Download
1 / 32
320 likes | 447 Views
Ghana has made remarkable strides in its journey as a democracy touting a stable economy, yet significant challenges remain. While many children attend school and receive meals, others still hawk goods on the streets. This examination highlights Ghana's economic dependency on cocoa trade, where fluctuations in global prices impact local income and sustainable development. Exploring models of Fair Trade and local cocoa processing, we analyze the interplay between history, trade policies, and the future direction Ghana should pursue to enhance social equity and economic resilience.

E N D
Ghana – which way now? Bob Digby Senior Vice-President Geographical Association
Frank Agyekum"Ghana has done well. It’s a thriving democracy with a stable economy; kids go to school and are fed.” • Samuel Ablakwa "So many kids are still on the streets hawking. I'm still carrying buckets of water on my head! Maybe our economists are cooking the figures." Ghana @50: Success or failure?
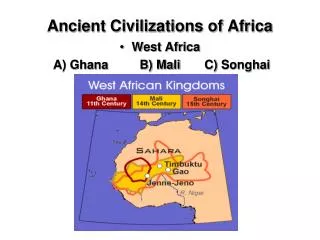
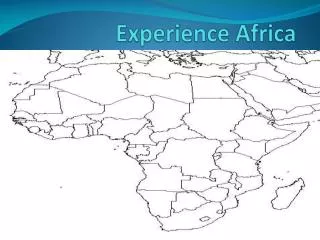
Some background Size: 230 000 km2 (nearly that of the UK) Population: 24.9 million (about 40% of the UK’s) Scale: 0 100 miles
How far has Ghana come in 50 years? • How far can Ghana be considered ‘independent’? • Which way should it go from 2011 onwards? Focus for tonight
Trade pattern (typical of a developing economy) • has barely changed in 100 years • Primary product exports dominate • Imports remain mainly manufactured goods • An example of dependency theory: developing • countries remain dependent upon developed • nations for trade. Key economic issues
Colonial times: Ghana the world’s largest producer of cocoa • Britain dictated the global cocoa price 2010: the world’s second largest producer • Who controls Ghana’s cocoa trade now? Ghana’s cocoa trade
Upward pressure • Price of cocoa decided in commodity trading exchanges in London and New York • Buyers buy cocoa for companies e.g. Cadbury or Nestle • Traders compete for supplies • Cocoa prices depend on global supply and demand, which vary Downward pressure • Other countries produce cocoa e.g. Ivory Coast now the world’s largest producer • If Ghanaian prices are too high, dealers purchase elsewhere Who controls trade? 1
Global price of cocoa is volatile • 1991-5: the price of cocoa changed 60 times • 1996-2002: it changed 90 times • Between Jan 1991 and Dec 1993 it increased by 112% • Between June 1998 and Dec 2000 it fell by 32.5% Cocoa price 1971-2004 Global price patterns Cocoa price Sept 2007-Jan 2008
Unstable prices cause: • irregular income for workers • low tax returns for government • poor government planning. Impacts upon people?
Sustained chocolate consumption • Western Europe & US are biggest markets; Asia, E Europe & Latin America growing rapidly • Consumers react badly to high prices or shortages • Very strong response to FairTrade brands but not to unknown brands • Opportunities for Ghana to market its own chocolate are few. Why not market Ghanaian chocolate?
Poverty in developing countries caused by a reliance on developed economies • Trade in primary goods keeps countries poor, because no value is added by processing or manufacturing. • Therefore, no jobs & profit for investment • Countries trapped in a vicious cycle Dependency theory
Andre Frank’s ‘Development theory’ • Colonialism causes low levels of development, • Keeps colonies poor • Tariffs (duties) on imported manufactured goods used to protect from cheaper imports Development Theory
In 2011 • EU Import tariffs on cocoa beans are lower than on processed cocoa. EU uses 'tariff escalation' • 0% duty on imported raw cocoa beans • 7.7% on cocoa powder • 15% on chocolates • Japan & USA – no duty on raw cocoa beans but tariffs of up to 65% on imported chocolate Who controls trade? 2
WTO (World Trade Organisation) • Ghana joined the WTO in 1995 • Previously, subsidies paid to farmers to grow food • WTO policy – abolish subsidies, develop free trade Who controls trade? 3
Allows ‘domestic support’ for producers. • Three categories: Green, Amber and Blue. • Green – subsidies for environmental reasons, e.g. if farmers reduce grain output and plant woodland; • Amber – subsidies that governments have agreed to reduce but not to cut. • Blue – subsidies given where production will be reduced in the long-term. Impacts • EU and USA still subsidise farmers $400 billion annually • 50% of EU subsidies go to largest 1% of producers • 70% of US subsidies go to largest 10% • Large farmers produce huge volumes, which governments buy and ‘dump’ on poorer countries as ‘aid’ WTO ‘Agreement on Agriculture’
Reduced domestic prices • Farmers put out of work. • Ghana’s tomato-growers can’t sell produce, as EU tomatoes are cheaper • Canning factories closed • Rice growers also flooded by imported rice from the US Impact of WTO Policies
To develop, countries seek a virtuous cycle whereby they keep surplus production, and invest in processing and manufacture, adding value. • Many cocoa farmers now form co-operatives. • Kuapa Kokoo (‘good cocoa farmers’) began in 1993; now has 40 000 members, producing 1% of global crop. • Strong bargaining power, selling to European FairTrade companies. • 1998 The Day Chocolate Company formed in UK, making ‘Divine’ chocolate. • Provides members with cheap loans, improved drinking water in rural areas, & health insurance. Where next?
Aid or investment? • Supplied mostly by western countries • Wealth created by employment in construction, manufacturing or developing primary products. • Wealth ‘trickles down’ via job creation, spending and increased demand. • Known as the ‘multiplier effect’ How to develop in future?
Top-down: • Occurs where strategic decisions are needed, about e.g. improving health care or schooling or infrastructure (e.g. provision of energy). • Decisions come from above • Imposed on communities • Useful for major projects Bottom-up: • Occurs at community level by identifying people’s needs • Develops small-scale projects to meet needs • Decisions and working come from communities and by NGOs (Non-Governmental Organisations) e.g. charities Top down or bottom up?
Built 1961-66 from both aid & investment • Multi-lateral – World Bank (loans – US$40 million), Ghanaian government (investment – US$69 million) & aid from USA and UK governments. • Akosombo Dam created Lake Volta, the world’s largest artificial lake. • Designed to provide HEP for smelting raw bauxite into aluminium Case Study: the Volta Dam
2005: Ghana’s government bought 90% of shares in VALCO smelter from Kaiser, hoping to re-start it • 2006: Production started • 2007: Ghana purchased the remaining 10% • 2008: Plant closed because of low water levels in Lake Volta caused by drought preventing electricity production • 2009-10: Low global prices of aluminium and bauxite kept it closed • 2011: reopened with 1 of the 6 smelters working Time to forge ahead?
Ghana was one of the first countries to have many of its debts cancelled after the 2005 G8 conference • In 2006, this saved Ghana US$166m in interest alone • Investment by the government in people and the economy possible • Debt cancellation took place on condition that all savings spent on improved education and health care Is there future hope?
Ghana’s Needs Safe Water • 2008: only 50% of Ghana’s population had access to safe, treated water • 60-70% of urban dwellers have access but only 35-40% in rural areas. • Even in urban areas, only 40% have a water tap that flows • Affluent Ghanaians buy from private sellers because public supply is so irregular • 78% of the urban poor have no piped water. • A Millennium Development Goal – to bring clean water to all by 2015 The World Bank says • Water treatment must not lead to increased government expenditure or debt • Loans for water systems only if they are privatised • People now have to pay for connection and supply – which many cannot afford. • Jobs are threatened as the new owner cuts costs & maximises profit. • Plans are to privatise only the urban water and sanitation systems. • What happens to rural water supplies? Joined-up thinking?
54 years since independence • Loss of British control • Debts mostly cancelled • Rapid economic growth caused by global commodity prices • Greatly improved social indicators • Several targets still ahead – e.g. water • Has spent most of that time in debt • Control of the country’s largest development projects in the hands of the USA • Future development influenced by the US-controlled World Bank • China seeking to influence Africa – and its resources So who’s in charge?
Thanks to the following; all images are for educational reference and use only • Photos from Ellie Doidge • Images and references ‘A2 Geography for Edexcel’ (2009) Oxford University Press) • CIA Factbook for Ghana 1987 and 2011 Acknowledgments