Download
1 / 31
320 likes | 570 Views
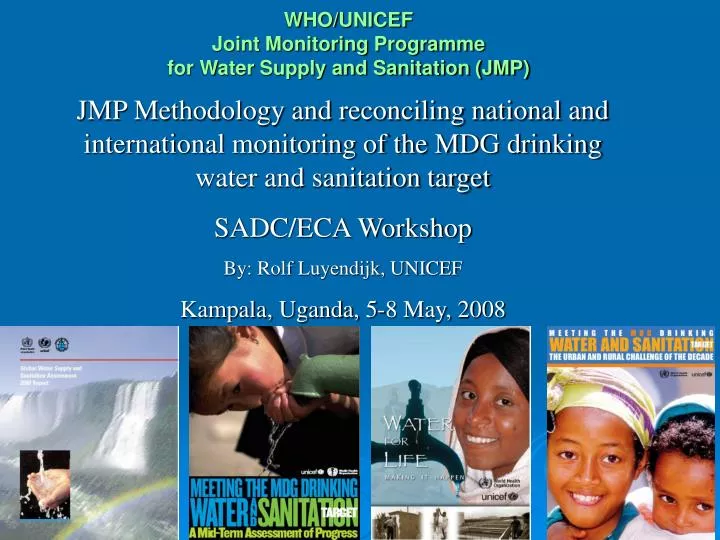
JMP Methodology and reconciling national and international monitoring of the MDG drinking water and sanitation target SADC/ECA Workshop By: Rolf Luyendijk, UNICEF Kampala, Uganda, 5-8 May, 2008. WHO/UNICEF Joint Monitoring Programme for Water Supply and Sanitation (JMP). This presentation.

E N D
JMP Methodology and reconciling national and international monitoring of the MDG drinking water and sanitation target SADC/ECA Workshop By: Rolf Luyendijk, UNICEF Kampala, Uganda, 5-8 May, 2008 WHO/UNICEFJoint Monitoring Programmefor Water Supply and Sanitation (JMP)
This presentation • Introduction • Data sources • JMP Methodology • Reconciling national and international monitoring
WHO-UNICEF Joint Monitoring Program (JMP) • Responsible for monitoring progress towards the MDG 7 Target 7C • Global accountability and advocacy • Biennial updates of coverage estimates • Water supply, sanitation, urban, rural, total, household connections, by country, region and global
MDG target + Indicators MDG 7 Target 7C: • Halve, by 2015, the proportion of people without sustainable access to safe drinking water and basic sanitation Indicators: • Proportion of population that uses an improved drinking water source, urban and rural • Proportion of population that uses an improved sanitation facility, urban and rural
MDG definitions of improved/unimproved sources of drinking water and sanitation facilities • Improved water supply • Piped into dwelling, plot or yard • Public tap/standpipe • Tube well/borehole • Protected dug well • Protected spring • Rainwater collection • Improved sanitation • Flush/pour flush to: • piped sewer system • septic tank • pit latrine • Ventilated improved pit (VIP) latrine • Pit latrine with slab • Composting toilet • Unimproved water supply • Unprotected dug well • Unprotected spring • Cart with small tank/drum • Tanker truck • Surface water (river, dam, lake, pond, stream, canal, irrigation canal) • Bottled water • Unimproved sanitation • Flush/Pour flush to elsewhere • Pit latrine without slab/open pit • bucket • Hanging toilet/hanging latrine • No facilities, bush or field
0% - 50% 50% - 75% 76% - 90% 91% - 100% No or insufficient data Water: Urban and rural disparities 2006 84% without access live in rural areas Rural Urban WHO/UNICEF JMP, 2008
Sanitation ladder Open Defecation Unimproved Shared Improved 1990 2006
Introduction • Data sources • JMP Methodology • Rationale for monitoring
Data sources on access to water supply and sanitation • 1980 – 1997 Reported data from Governments • 1997 – data from household surveys and censuses • JMP data sources are primary sources: • National household sample surveys (DHS, MICS, LSMS, CWIQ, WHS, HBS, H&N, RHS, PAPFAM etc) • National census • Note: JMP is not involved in primary data collection
JMP – data base (2007) • Data for +/- 170 countries • 600+ results of HH surveys + Censuses from 1985 – 2006 • Bulk of surveys for LDCs, SSA, larger developing countries • 30 - 40 new survey results per year • Frequency for most developing countries one survey every three years
How does the JMP obtain data? • UNICEF Country offices – annual submission of new survey/census data to HQ • MICS/DHS/WHS - through UNICEF, ORC-MACRO and WHO • IHSN – International Household Survey Network • Web-searches from NSO websites • Direct contact with NSO’s
Survey validation • Do we know the survey and survey authorities? • Is the survey nationally representative? • Do we have the original source documentation? • Reliability check against other indicators
Introduction • Data sources • JMP Methodology • Reconciling national and international monitoring
Monitoring MDG drinking water and sanitation targets • A country’s responsibility • At global level: JMP • Challenges: • Track progress over time • Track progress towards the MDG target vs. baseline year 1990 • Ensure comparability over time • Ensure comparability of data among countries (JMP specific challenge)
JMP methodology • Collection survey information • Validate survey information • Ensure comparability among different surveys (including some country level consultations) • Plot survey data on time scale (urban + rural) • Draw linear regression line • Calculate total coverage based on urban & rural coverage data
Adjustments made to survey or census data set (1) Example: • HBS ‘86: Latrine: 58% Improved • DHS ‘89: Pit: 62% Improved ? • Census ‘92: Open pit: 59% Not improved • MICS ‘95: Traditional latrine: 60% Improved? • How to interpret these categories? • Suggested re-classification: • Pit latrine with a slab • Pit latrine without a slab/open pit
Adjustments made to survey or census data set (2) Example: • DHS ‘98: Well: 22% Improved? • Census ‘00: Protected dug well: 14% Improved • Census ’00: Unprotected dug well: 6% Not Improved Did coverage drop by 22 -14 = 8% over the period 1990-2000? • Suggested re-classification: • Tube well/borehole • Protected well • Unprotected well
Estimates Coverage 2004 = 50% Latest data point DHS 2002 :51%
Estimates Coverage 2004 = 50% = 54% 2006 = 57% Added Fictive data point 2005 :58%
Estimated Coverage 2004 estimate = 50% Latest data point DHS 2002 :51%
2004 = 50% = 54% 2006 = 57% Estimated Coverage 2004 = 50% = 49% 2006 = 52% Added Fictive data point 2005 :58% Added Fictive data point 2005 :49%
JMP Methodology • Per country: • Trendlines for urban and rural sanitation coverage • Trendlines for urban and rural drinking water coverage • Population data from UN Population Division • Total population • proportion urban population • Calculate total national coverage • Note: JMP does not take total coverage data directly from surveys or census data
Introduction • Data sources • JMP Methodology • Reconciling national and international monitoring
Data discrepancies • Use of different definitions of access • Use of different population data • JMP always uses projections – countries often report on latest census or survey findings • Difference in denominator population vs. households
Questions How to reconcile definitional issues between national and international monitoring? • Should international definitions take into account (some) national definitions? E.g. shared facilities, traditional latrines? • Should national data (and definitions) be published alongside international estimates? • At what point should line ministries get involved in the discussion on definitions and what if they propose additional access criteria? • How to ensure survey data compatibility for national and international monitoring? • Reporting of latest survey data or use of projections? • How to ensure international monitoring uses all available survey data?
JMP Methodology - Summary • Primarily based on user data derived from household surveys and censuses rather thandata reported by governments • Adjustments made to full historical series to ensure comparability over time and between countries • Use linear regression to extrapolate and interpolate reference years instead of using the latest household survey data
JMP Website: www.wssinfo.org • JMP country files • Four graphs with regressions line • All HHS + census data per country • Regional and global coverage estimates • Core questions on water supply and sanitation for household surveys • Standard indicators • Definitions of service categories