Download
1 / 42
420 likes | 584 Views
Crop Surveillance Demonstration Using a Near-Daily MODIS Vegetation Index Time Series. Robert E. Ryan Science Systems and Applications Inc. NASA Applied Sciences Directorate Stennis Space Center May 16, 2005 Multi-temp 2005. Contributors. Rodney McKellip NASA ASD Donald Prados CSC

E N D
Crop Surveillance Demonstration Using a Near-Daily MODIS Vegetation Index Time Series Robert E. Ryan Science Systems and Applications Inc. NASA Applied Sciences Directorate Stennis Space Center May 16, 2005 Multi-temp 2005
Contributors • Rodney McKellip NASA ASD • Donald Prados CSC • Slawek Blonski SSAI
Crop Surveillance System Requirements System must detect subtle changes in plant health and environmental conditions in their earliest stages, before the effects of a disease outbreak or environmental conditions can become widespread and devastating. • Spatial resolution • Sufficient to detect significant changes to crop health • Coarse enough to be practical. • Temporal resolution • Sufficient to detect unexpected changes in crop health within days. • Affordable
Crop Surveillance Methods In-situ methods Remote Sensing • Small number of data points • Limited coverage • Labor intensive • Expensive • Vulnerable to politics • Accurate • Not limited to surface • Day/night all-weather • Large number of data points • Large coverage • Can be automated • Relatively inexpensive • Ignores politics • Can be inaccurate • ~Limited to surface • Affected by atmosphere Remote sensing is the only method that can be used today to monitor large areas.
Architecture Speculations • Total system will require all source solution. • Remote sensing will be dominant component. • Cloud statistics and cost of launching future systems will require use of many systems including international ones. • Some places in the world could require active airborne solutions • Problem can be cast as a detection/estimation problem.
Architecture Issues • Interoperability of a variety systems • Spatial Scales • 1-1000 m range • Time Scales • Products • What should they be? • Radiometric calibrations • Spectral bandpasses • Solar and viewing geometry • Detection • How do we set thresholds or detect anomalies? • What are the natural variations?
Potential Crop Surveillance System Architecture Near-Daily Wide Area Surveillance MODIS/AVHRR Inexpensive Anomaly Surveillance Large Swath Systems Coarse Resolution Spectral Time Series Analysis Agriculture Database Crop Models &Geospatial Detection (Time Series & Coarse Spatial/Spectra) Meteorology & In Situ Data Moderate & High Spatial Resolution Surveillance Commercial Satellite Systems Targeted Moderate/High Spatial Resolution Systems (Expensive Acquisitions) Moderate & Small Swath Systems High Spatial Resolution Analysis Scouts/Remediation
Asset Revisit Time Spectral Bands/Spatial Resolution (GSD) Swath/Image Size Terra/Aqua MODIS 1-2 days 250 m R, NIR, 500 m Vis-SWIR 1 km Thermal 2200 km SPOT 4 and 5 Vegetation 1 day B,R,NIR,SWIR 1 km 2250 km AVHRR NOAA 1-2 days R, NIR, MWIR, 3 TIR 1.1 km 2940 km ENVISAT-1 AATSR 3 days G, R, NIR, SWIR, MIR, 2 TIR 1 km 500 km Relevant Coarse Resolution Systems MODIS is the highest resolution (250 m) large swath system
Asset Revisit Time Spectral Bands/Spatial Resolution (GSD) Swath/Image Size SPOT-4 1-2 days G, R, NIR, SWIR, IR, Pan 20 m (multi) 10 m Pan 60 km Landsat 7 ETM+ 16 days B, G, R, NIR, SWIR, 30 m 60 m TIR 180 km IRS-P6 LISS3 5 days G, R, NIR, SWIR 24 m 23.9 km, 70.3 km IRS-P6 AWiFS 5 days G, R, NIR, SWIR 56 m 740 km Terra ASTER 4-16 days 30 m G, R, NIR, 60 m SWIR, 90 m LWIR 60 Km Relevant Moderate Resolution Systems
Asset Revisit Time Spectral Bands/Spatial Resolution (GSD) Swath/Image Size IKONOS 1-2 days B, G, R, NIR, Pan 4 m (multi) 0.86 m (pan) 11 km QuickBird 2 1- 5 days B, G, R, NIR, Pan 2.44 (multi) 0.61 m (pan) 16.5 km OrbView-3 < 3 days B, G, R, NIR, Pan 4 m (multi) 1 m (pan) 8 km Relevant High Spatial Resolution Systems Geolocated and radiometrically corrected products available.
Multi-resolution Crop Surveillance • Coarse-resolution systems (250-1000 m GSD), such as the Moderate Resolution Imaging Spectroradiometer (MODIS), provide regional and continental views with frequent revisits. • Medium-resolution systems (10-100 m GSD) provide field-level information but typically have infrequent revisits. • High-spatial-resolution systems (<10 m GSD) can provide spatial analysis at the row level. An integrated, multi-resolution, remote-sensing monitoring system will probably include a Normalized Difference Vegetation Index (NDVI) Product. (Red and NIR bands are available for all systems)
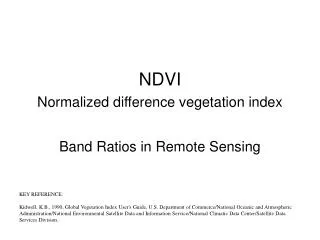
NDVI Definition of NDVI: Includes material © Space Imaging, LLC Where NIR and RED are in-band ground reflectance 10.8 Km IKONOS NDVI of Stennis Space Center, MS 1/15/2002 Normalized Difference Vegetation Index (NDVI) NDVI based on reflectance maps (atmospheric correction) Reduced influence of atmosphere and solar illumination variations Improved intercomparisons between different instruments and acquisitions • Most commonly used vegetation index
Objectives • Examine utility of the Moderate Resolution Imaging Spectroradiometer (MODIS) for understanding signatures and specifications for wide area crop surveillance • Can we measure “ideal” crop signatures?
Approach • Produce coarse spatial resolution, near-daily NDVI time series using the atmospherically-corrected MODIS surface-reflectance product. • Study areas having high number of cloud-free days and known ground truth • Use standard products for validation • Generate new products where necessary • Examine known crop models (cotton fields with defoliants applied as rapidly propagating disease analogs).
Near-daily MODIS NDVI and Other Crop Monitoring Products • Near-daily NDVI product • Based on MODIS MOD09 daily surface reflectance product • Pixel quality assurance, temporal interpolation and smoothing usedto reduce noise • Remove all non-ideal pixels • Median and Savitzky-Golay filtering • Single pixel time series (MOD13 and MOD09 NDVI) • AVI Image Movies (MOD13 and MOD09 NDVI) • Complements MOD13 16-day composite NDVI • Standard Science Team validated product • Used for validation of MOD09 NDVI generated product
Study Area • San Joaquin Valley, California – Sheely Farm • (Ground truth available for cotton fields with defoliants applied for rapidly propagating disease analogs) QuickBird color-infrared imagery acquired over San Joaquin Valley, CA, on July 26, 2003 Application V&V data: Crop shape file and growing season data by field
Why Sheely Farm? • Located in San Joaquin, CA • High value agricultural region • Large number of clear days with excellent cloud statistics. • Existing ground truthing data exists • AG20/20 project through NASA’s Stennis Space Center. • Shape files of fields • Spray schedules associated with the application of defoliants to the cotton crop. • QuickBird imagery available over most of 2003 growing season
Noise Analysis Examples Raw Data NDVI values drop during cloudy days
Noise Analysis Examples Pixel metadata can be used to ignore bad pixels and pixels affected by clouds
Noise Analysis Examples Savitky-Golay or Median filter can further reduce the noise.
Near-Daily NDVI Time Series Example Digitally Filtered MOD09 NDVI Time Series Sheely Farm Cotton Field 5-3 Raw MOD09 NDVI Time Series Sheely Farm Cotton Field 5-3 Digital filtering significantly improves Signal-to-Noise ratio while preserving shape
MOD09 NDVI AVI Movie Fields are slightly under 1 km in size
High Spatial ResolutionCommercial Products • Standard true color and color-infrared products • High resolution NDVI based on atmospherically corrected commercial products (IKONOS and QuickBird) • Standard commercial products are radiometrically and geopositionally corrected only.
Optical Depth Water Vapor, Near Infrared Atmospheric Correction of High Resolution Imagery • Leverage SSC commercial imagery radiometric characterizations • IKONOS, QuickBird, OrbView-3 (future) • Use daily coverage from MODIS to provide input data for atmospheric correction • MOD04 Aerosol Optical Thickness • MOD05 Total Precipitable Water (Water Vapor) • Generate MODIS-like products • Surface Reflectance (MOD09) • Gridded Vegetation Indices – NDVI (MOD13)
MODIS Atmospheric Products MOD04, MOD05 High Spatial Resolution Commercial Products Radiative Transfer Model Reflectance Map NDVI Map Atmospheric Correction Approach
Atmospherically Corrected IKONOS NDVI High spatial resolution (4 m) commercial-system-derived vegetation index using NASA satellite provided atmospheric data and radiometric characterization Interoperable product with MODIS and other sensors Comparable NDVIs generated from MODIS
Summary • Coarse resolution NDVI products, based on near-daily MODIS surface reflectance, crop signature demonstrated in Southwest United States. • Requires high percentage of cloud free days • Good location to develop crop signatures • Standard 16 day product misses key changes • Weekly (daily desirable) • Quality assurance data extremely valuable in developing products • High spatial resolution data (virtual ground truthing) • Simple digital filtering can reduce “noise” (unwanted variations) significantly • Mixed pixels at 250 m significant at field boundaries • General rule of thumb ~3-5 pixels from field edges required for pure pixels