Download
1 / 11
110 likes | 207 Views
A study developing a method to estimate crop production with SPOT/VEGETATION data by integrating soil, climate info in growth models. Focus on wheat crops based on ADAM experiment in Romania. Results show good consistency in LAI dynamics.

E N D
National Institute for Agronomy research Department of Agronomy and Environment Bucharest, Fundulea, Romania Toulouse, France A Bottom-up Approach to Characterize Crop Functioning From VEGETATION Time series F. Oro.(1), F. Baret (1), C. Lauvernet (1), R. Vintila (2), N. Rochdi (1) H. de Boissezon (3) (1) INRA,CSE,Avignon,France (2) ICPA, Bucarest, Romania (3) CNES, Toulouse, France foro@avignon.inra.fr Antwerp march 24-26 2004
Introduction Context Yield estimation/forecasting at regional/national/continental/global scales is required for improved security and market management. Users are governments, FAO, NGOs, traders… This question is part of GMES issues The monitoring of crops at these scales is currently only accessible operationally from large swath sensors such as VEGETATION that provides enough revisit frequency Problem: Difficulty to monitor each individual crop because of mixed pixels HRV VGT 1km Antwerp march 24-26 2004
Objective To develop and evaluate a method to estimate crop production with SPOT/VEGETATION data Approach: forcing a crop growth model with LAI dynamics derived from remote sensing: allow to integrate soil & climate available information within the growth model Cultural practices LAIdynamics Stics Meteorological data SPOT VEGETATION Soil characteristics Production How to derive LAI dynamics of specific crops from VEGETATION time series??? Antwerp march 24-26 2004
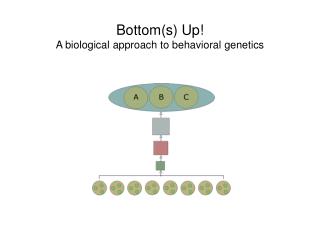
A bottom-up approach to retrieve LAI dynamics Actual VEGETATIONtime series Comparison AGREGATION Classification SPOT/HRV 20x20 m² Ajusting parameters Simulated VEGETATIONtime series Ci ri(t) RT model LAIi(t) MODLAI Measured Temperatures [LAImax,Ti,DTs,a,b] MODLAI parameters Antwerp march 24-26 2004
Detailed objectives of the study • evaluate the approach in two steps: • 1- develop the approach based on simulations using a series of SPOT/HRV images • Define the LAI dynamics models for different covers • Get prior information on the distribution of the parameters • Evaluate RT models for reflectance simulation • and to investigate the sources of uncertainties • 2- Evaluate the approach over actual VEGETATION data The study is based on the ADAM experiment Antwerp march 24-26 2004
The ADAM experiment Other 12% Fundulea Alfalfa 6% Pea 8% Water 2% Romania • Forest 4% Maize 36% Wheat 32% www.medias.obs-mip.fr/adam Focus on wheat crops 10 Km x 10 Km The data collected in 2000-2001 Antwerp march 24-26 2004
Results: Temporal profiles of reflectances of each cover Extraction of 100 pixels for each cover class in the red and near infrared bands Maize Alfalfa Forest Water Pea Wheat Antwerp march 24-26 2004
Results: Deriving LAI temporal profiles Inversion of RT model (SAIL+PROSPECT) over the 100 pixels LAI Inverting RT model (SAIL+PROSPECT) to get canopy variables Example of the wheat crop LAI Leaf angle Chlorophyll Leaf structure Hot-spot Soil brightness Leaf dry matter Good consistency of Retrieved variables Consistent Canopy variable retrievals Antwerp march 24-26 2004
Results: Adjusting LAI dynamics model Ti,DTs: Significant dates of the life cycle of cultures a, b: rate of growth and senescence a b LAImax DTs Ti Retrieving MODLAI parameters [LAImax,Ti,DTs,a,b] for the 100 pixels and each class Example of the wheat crop Good description of the Dynamics of LAI values Antwerp march 24-26 2004
Results: prior distribution of MODLAI parameters Computation of the distribution of the MODLAI parameters: It will constitute the prior distribution used in the bottom-up approach LAImax DTs Ti Good consistency of the distribution of parameters b Antwerp march 24-26 2004
CONCLUSION • Interest of the proposed bottom-up approach: • Innovative approach to combine • - few high spatial resolution images (land cover classification) - with high temporal frequency medium resolution temporal series • Less dependant on scaling • Potential problems • Variability within one cover class? But using mixed models would allow to account for • Impact of the performances of the models used ?: MODLAI and RT models? • Effect of the VEGETATION registration? apply the approach to resolution larger than 1km? • Status of the study • The study is still under development… next steps: • Adjusting the MODLAI parameters to complete the bottom-up loop • Evaluate the sources of uncertainties: registration, variability within cover class, … • Apply the approach to actual VEGETATION data and evaluate the performances • Compare the performances of this bottom up approach with top-down approaches (desagregation) • Force the STICS growth model to evaluate the performances of yield estimation Antwerp march 24-26 2004