Download
1 / 1
10 likes | 173 Views
Correction of Vegetation Time Series for Long Term Monitoring. Correction of Vegetation Time Series for Long Term Monitoring. 1989 Week 40 . 1991 Week 23. 1991 Week 43. 1991 Week 33. 1990 Week 40. NOAA-14. NOAA-11. NOAA-9. NOAA-16. NOAA-18. NOAA-7. 1991 Week 40. 1992 Week 12.

E N D
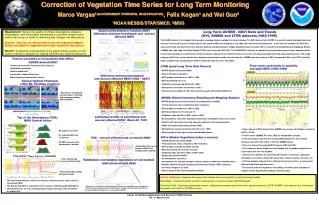
Correction of Vegetation Time Series for Long Term Monitoring Correction of Vegetation Time Series for Long Term Monitoring 1989 Week 40 1991 Week 23 1991 Week 43 1991 Week 33 1990 Week 40 NOAA-14 NOAA-11 NOAA-9 NOAA-16 NOAA-18 NOAA-7 1991 Week 40 1992 Week 12 1993 Week 12 Reduced NDVI NOAA-11 NOAA-14 1992 Week 40 NOAA-16 NOAA-9 NOAA-18 NOAA-7 Recovery Latitude Band 7.5N – 7N Difference between benchmark and aerosol affected NDVI (1982 – 2007) Latitude • Excessive stratospheric • aerosol reduce incoming • and outgoing radiation • affecting NDVI. Latitudinal profile of benchmark and aerosol affected NDVI Week 40 1991 Top of the Atmosphere (TOA) NDVI Central Africa • Higher values of NDVI derived from GIMMS (seen across all latitudes) compared to GVI & LTDR. • All time series (GIMMS, GVI and LTDR) are comparable in shape. • Time series plots show that the GVI and LTDR datasets are more similar between each other than either is with the GIMMS dataset. • There is a trend of increasing NDVI between 1982 and 1999. • The trends give some insight into the changes that the global vegetation has experienced over the last decades. • Differences in datasets are caused by differences in resolution, calibration, atmospheric correction, orbital drift correction, volcanic aerosol correction, etc. • All three datasets compared have different levels of correction, are processed differently and have potential errors. • This results show the importance of building a unified system to produce a reliable Climate Data Record (CDR) for climate studies. • 89 and 90 no aerosol • 91 reduced NDVI due • to aerosol • 92 NDVI recovery after • dissipation of aerosol YEAR • Years affected by • aerosol (yellow shade) • Years affected by orbital • drift (pink shade) YEAR Marco Vargas¹(GOVERNMENT PRINCIPAL INVESTIGATOR), Felix Kogan¹ and Wei Guo² ¹NOAA/NESDIS/STAR/SMCD, ²IMSG Marco Vargas¹(GOVERNMENT PRINCIPAL INVESTIGATOR), Felix Kogan¹ and Wei Guo² ¹NOAA/NESDIS/STAR/SMCD, ²IMSG Empirical Distribution Function (EDF) difference between benchmark and aerosol affected NDVI Requirement: Improve the quality of climate observations, analyses, interpretation, and archiving by maintaining a consistent climate record and by improving our ability to determine why changes are taking place. Science: How can we remove biases from the vegetation dataset that are unrelated to vegetation and create consistent time series? Benefit: A predictive understanding of the global climate system on time scales of weeks to decades for making informed and reasoned decisions. Long Term AVHRR - NDVI Data and Trends (GVI, GIMMS and LTDR datasets,1982-1999) The AVHRR dataset is the longest daily synoptic coverage dataset available for climate studies. The NDVI derived from AVHRR is a proxy for plant photosynthesis and has been extensively used for climate studies. The satellite NDVI record begins in July 1981 and extends to the present time. In this work we compare the NDVI time series and trends extracted from three different publicly available datasets: Global Vegetation Index x-version (GVI-x), Global Inventory Modeling and Mapping Studies (GIMMS) and Land Long Term Data Record (LTDR) over the period 1982-1999. The AVHRR-NDVI datasets are subject to uncertainty because of errors associated with sensor and atmosphere related effects. All three datasets compared have different levels of correction, are processed differently and have potential errors. This study compares NDVI time series from the three datasets and estimates trends. Results show that GIMMS has higher values of NDVI compared to GVI-x and LTDR, and also larger upward trends compared with smaller trends derived from GVI-x and LTDR. Factors unrelated to ecosystems that affect AVHRR derived NDVI • LTDR (Land Long Term Data Record) • AVHRR data processed by NASA. • Daily, 0.05 degree resolution. • NDVI product available from 1981 to 1999. • NDVI from NOAA 7,9,11,14. • Calibration (Vermote and Kaufmann, 1995). • Atmospheric Correction of channels 1 and 2. • Data products available at http://ltdr.nascom.nasa.gov/ltdr/products2007.html Time series and trends in spatially averaged NDVI (1982-1999) • Volcanic aerosols (Mt. Pinatubo and El Chichon). • Calibration uncertainty. • Satellite orbital drift. • Intersatellite sensor differences. • Bidirectional and atmospheric effects. Aerosol Optical Thickness (after Mt. Pinatubo eruption) • GIMMS (Global Inventory Modeling and Mapping Studies) • AVHRR data processed by the University of Maryland and NASA. • 15-Day maximum value composites, 8 km resolution. • NDVI product available from 1981 to 2006. • NDVI from NOAA 7,9,11,14,16 and 17. • Calibration (Rao and Chen 1995, and Los 1995). • No atmospheric correction, Rayleigh scattering or stratospheric ozone correction. • Satellite drift have been corrected using the empirical mode decomposition • (EMD) during post-processing (Pinzon 2002). • Stratospheric aerosol correction (Vermote et al., 1997). • Data available at http://glcf.umiacs.umd.edu/data/gimms/ • GVI-x (Global Vegetation Index x-version) • AVHRR data processed by NOAA. • 7-Day maximum value composites, 4km resolution. • NDVI product available from1981 to 2009. • NDVI from NOAA 7,9,11,14,16,17 and 18. • Calibration (Rao and Chen 1995, and Wu 2004). • Statistically smoothed NDVI. • No atmospheric correction. • Normalization for volcanic aerosols, extreme cases of orbital drift and differences • between satellites using the Empirical Distribution Function (EDF) statistical • technique (Vargas et al. 2009). • Data available at ftp://ftp.orbit.nesdis.noaa.gov/ TOA – aerosol affected and corrected NDVI • Normalized time series • enhances NDVI and • exhibits better stability TOA NDVI Time Series (AVHRR) Validation: correlation dynamics of corrected and uncorrected data Science Challenges: Generate time series with climate data record quality for climate change studies. Next Steps:Implement system to perform atmospheric correction on entire AVHRR dataset. Transition Path: Generate experimental version, validate and compare results with other available datasets (LTDR, GIMMS), and transition the GVI system to operations through the SPSRB process. • The statistical method to remove the effect of volcanic aerosols makes use of a • Benchmark NDVI. • The Benchmark NDVI is calculated from five years of NDVI data (89,90,95,96,97). • Benchmark years are not contaminated by volcanic aerosols and not affected • by orbital drift. Dynamics of correlation coefficient between end-of-season MG corn yield departure from trend and spatial-average VCI during corn silking (critical period), solid line is normalized NDVI, dashed line is aerosol-affected NDVI.