Download
1 / 17
170 likes | 348 Views
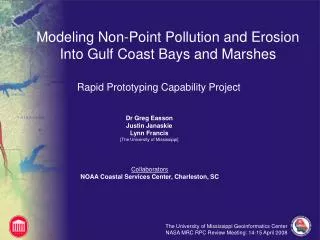
Modeling Non-Point Pollution and Erosion Into Gulf Coast Bays and Marshes. Rapid Prototyping Capability Project. Dr Greg Easson Justin Janaskie Lynn Francis [The University of Mississippi]. Collaborators NOAA Coastal Services Center, Charleston, SC. Outline. Objectives Background

E N D
Modeling Non-Point Pollution and Erosion Into Gulf Coast Bays and Marshes • Rapid Prototyping Capability Project Dr Greg Easson Justin Janaskie Lynn Francis [The University of Mississippi] Collaborators NOAA Coastal Services Center, Charleston, SC
Outline • Objectives • Background • Project Overview • Expected Impacts • Progress Report (April 2008) • Upcoming Major Tasks • Timeline
Project Objectives • Integrate next generation NASA data into NOAA’s N-SPECT (Non-point Source Pollution and Erosion Comparison Tool model) to generate more accurate model results • Evaluate N-SPECT performance using proxy Global Precipitation Measurements (GPM) data modeled from TRMM data and compare results to precipitation data currently suggested by NOAA 1
Study Area: Mississippi Gulf Coast, Bay St Louis and Pascagoula River Watersheds Rationale: -long history of hydrologic work -extensive infrastructure -long history of hydrologic data
TRMM and PRISM data comparison 3 hour TRMM 5 km resolution precipitation radar image of Hurricane Georges at landfall – Sept. 28, 1998 PRISM – 4 km resolution Monthly precipitation spatially modeled from stream gauge measurements Sept. 1998
Background: N-SPECT • N-SPECT – Non-Point Source Pollution and Erosion Comparison Tool developed by NOAA Coastal Services Center uses spatial elevation data to calculate flow direction and flow accumulation through a watershed. Required inputs: • Land cover grid, • Digital Elevation Models, • Precipitation grid, • Pollutant coefficients, and • Soils data • The model is a GIS based extension to ESRI’s ArcGIS software package that helps coastal managers predict potential water quality impacts from nonpoint source pollution and erosion
Background: N-SPECT • N-SPECT provides decision makers with the following features: • Accumulated runoff, pollutant and sediment load grids, • Pollutant concentration grids, • Pollutant assessment grid, which compares the resulting concentrations in receiving waters to user-specified water-quality standards, • Different land-cover scenarios such as new development can be added to model potential changes
Project Overview Current N-SPECT input process: • Uses point gage precipitation measurements or modeled spatial data from point measurements such as Oregon State University’s Parameter-elevation Regressions on Independent Slopes Model (PRISM) • Uses the Revised Universal Soil Loss Equation (RUSLE) to calculate erosion Problem definition: • Certain regions have limited stream gauging stations which can lead to limited and generalized watershed erosion and pollutant estimates
Project Overview • This project will compare data for a large rainfall event over the study area using GPM (modeled from TRMM) to PRISM data. Hurricane Georges hit the US Gulf Coast on September 28,1998 with rainfall of up to 20 to 30 inches locally.
Expected Project Impact: TThe increase in resolution and quality of erosion and pollutant information will significantly improve the accuracy of predicting non-point source pollution loadings within watersheds, which in turn: • WWill improve the design and implementation of watershed conservation programs. • WWill provide short and long term improvements in water quality management and improve human health.
Progress Report Presentation Outline: Data collection Processing & Analysis Results/outcomes Timeline April, 2008
Data Collection: complete Research Application: • NASA’s future Global Precipitation Measurement (GPM scheduled to launch in 2013) mission will improve current N-SPECT precipitation data • The GPM sensors will provide significantly improved resolution over TRMM data • TRMM data processed and resampled to simulate GPM data for this project
Processing & Analysis • NOAA CSC provided data: • 30 m land cover (NLCD) • DEM • Soils (SSURGO) • PRISM precipitation • Data preparation for use in the N-SPECT model • Completed processing of TRMM data for 1998 Hurricane Georges
Issues • N-SPECT 2.0 Beta • Enhanced performance • Resolves issues with watershed, land cover curve numbers and pollutant coefficients
Remaining Major Tasks: • Run N-SPECT models using accepted CSC datasets - PRISM • Run N-SPECT model using simulated GPM generated from TRMM data • Compare results • Document results
Contact Information: • Greg Easson, Director UMGC • 662 915 5995 • geasson@olemiss.edu • Lynn Francis • UMGC • 228 688-3197 • lfrancis@olemiss.edu • Justin Janaskie • UMGC • 662 915 6540 • jpjanask@olemiss.edu