Download
1 / 21
210 likes | 403 Views
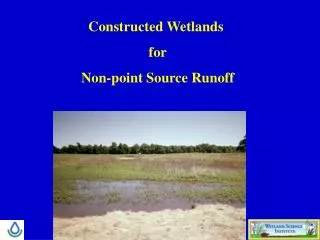
Non-Point Source Pollutant Modeling. Analysis and Prediction David Munn. Non-Point Source Pollution. Does not come from a single source Results from pollutants being washed out of large areas during storms Difficult to model without use of GIS or current NPSP models. Goals.

E N D
Non-Point Source Pollutant Modeling Analysis and Prediction David Munn
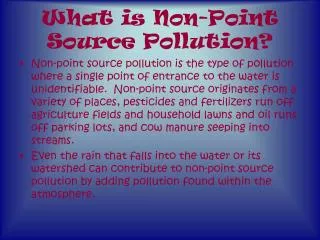
Non-Point Source Pollution • Does not come from a single source • Results from pollutants being washed out of large areas during storms • Difficult to model without use of GIS or current NPSP models
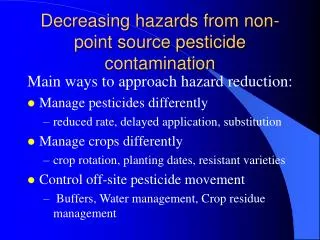
Goals • Predicting pollutant runoff loads • Defining problem areas within the Watershed • Determine what factors effect pollutant loading • Determine streams with highest impact • Pollutants considered: • BOD • Suspended Solids • Total Phosphorous • Total Nitrogen
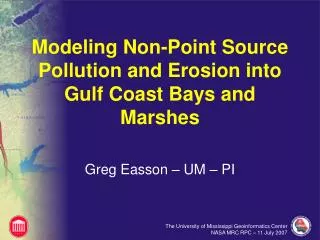
Study Area • Brazos County • Buffered boundary
Process Overview • Gather data • Data preparation • Reproject grids and shapefiles • Clip themes and set analysis extents • Calculate curve numbers • Delineate watersheds • Calculate pollutant contribution • Determine weighted accumulation • Analyze data
Data/Themes • DEM • TNRIS • Soil Classification • STATSGO • County Boundaries • ESRI, Tiger files • Land Use/Land Cover • Txdata, Provided by Dr. Olivera • Precipitation • Txdata, Annual and Monthly • LULC Pollutant Contribution Data • Cornell University Hydraulics Study
Reprojecting • Reprojected grids using ArcInfo-Workstation • Reprojected geographic shapefiles using CRWR-Vector • Data Already in a Projection was reprojected using ArcCatalog • Final Projection: State Plane 1927 • Central Texas, Zone 5376 • Units = feet
CRWR-Prepro Burned in Streams Filled Sinks Determined Flow Direction Determined Flow Accumulation Defined Streams Segmented Streams Defined Outlets Delineated Watersheds Vectorized Grids Delineating Watersheds
Curve Numbers • Used to determine runoff • STATSGO data spatially documents soil types (component makeup) • Scripts provided by CVEN 689 Website • Soilgrp script – calculates % of hydrologic groups per soil type • cn script – creates curve numbers based on soil composition
Rainfall given per month (January) Calculate Run-off (mm) using SCS method Map Calculator combined formulas with rainfall and CN Created new grid giving run-off depth per cell Run-off
Pollutant Contributions Q (mm) Cell size (ft2) Pollutant Concentration (mg/l) = Mass (mg) * Map Calculator
Pollutant Flow/Accumulation • Weighted flow accumulation • Executed in ArcInfo • Assigns weights to cells based on a Grid Weights Direction Accumulation
Analysis • Determine what land-uses and soil types contribute the largest amount of pollutants • Determine what rivers suffer the greatest impact • Locate areas that contribute large masses of pollutants
Impacted Rivers • Method • Map query • Changed to shapefile • Results too dependent on general accumulation • More statistical work needed
Areas of Concern * TP / TN * BOD / SS
Conclusions • Urban areas contributed the largest mass of BOD and suspended solids per unit area • Agricultural areas contributed the largest mass of Nitrogen and Phosphorous / area • Rivers > 700,000 cell accumulation were impacted • Soil types differed in impact between pollutants • Nutrients: Crocket-Luling-Benchley & Zack-Zulch-Booneville • BOD and Suspended Solids Zack-Zulch-Booneville
Future Applications • Determining Pollutant Concentrations • Calculate run-off volume using weighted accumulation • Sum run-off volumes with base flows • Calculate in-stream concentrations • Better Statistical Analyis of Impacted Rivers
Problems • REPROJECTING!!!!!!! • Calculating pollutant contributions (map calculator) • Floating point analysis
QUESTIONS What up?