Download
1 / 8
80 likes | 108 Views
MPE.Logging/nupshot is a distributed logging library included with MPICH, producing trace files in ALOG format. It provides additional routines for user-defined events and states, and supports visualization displays like timelines and mountain ranges.

E N D
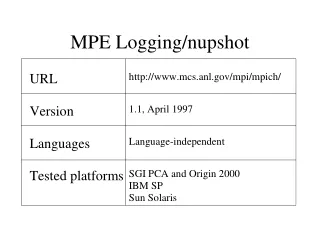
MPE Logging/nupshot • Included with MPICH 1.1 distribution • Distributed separately from rest of MPICH from PTLIB • MPE logging library produces trace files in ALOG format • nupshot display trace files in ALOG or PICL format • Minimal documentation in MPICH User’s Guide and man pages
MPE Logging Library • MPI profiling library • Additional routines for user-defined events and states • MPE_Log_get_event_number • MPE_Describe_event • MPE_Describe_state • MPE_Log_event
MPE Logging Library (cont.) • MPI application linked with liblmpi.a produces trace file in ALOG format • Calls to MPE_Log_event store event records in per-process memory buffer • Memory buffers are collected and merged during MPI_Finalize • MPI_Pcontrol can be used to suspend and restart logging
nupshot • Current version requires Tcl 7.3 and Tk 3.6 • Must be built with -32 on SGI IRIX • Visualization displays • Timeline • Mountain Ranges • State duration histograms • Zooming and scrolling capabilities
Timelines Display • Initially present by default • Each bar represents states of a process over time with colors specified in log file. • Clicking on bar with left mouse button brings up info box containing state name and duration. • Messages between processes are represented by arrows.
Other Displays • Mountain Ranges • Use Display menu to bring up this view • Color-coded histogram of states present over time of execution • State duration histograms • Accessed by menu buttons that pop up according to which states were found in log file