Download
1 / 14
131 likes | 172 Views
This presentation on PET Scan, will increase our understanding of how structures in the nervous system relate to one another. This presentation explains the purpose of the technique, how it works, and how it is performed. Four research papers were used to create this presentation.

E N D
What is PET Scan? • Positron emission tomography (PET) is an imaging technique that uses compounds as molecular probes to evaluate various neurological processes quantitatively and noninvasively. PET uses compounds labelled with radioactive elements that emit particular types of particles called positrons. (Papanicolaou, 2014). • PET brain is a crucial tool in neuroimaging, neurology, and neurosurgery for resolving clinical issues (Stanescu, 2016).
The most widely used radiopharmaceutical for PET imaging is 18F-fluorodeoxyglucose ([18F]FDG), which evaluates the cerebral metabolic rate for glucose and is used to assess brain function, seizure disorders, dementia, and brain malignancies (Papanicolaou, 2014).
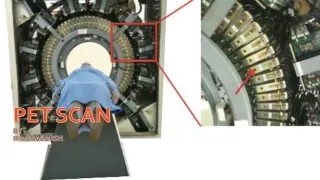
Although a longer uptake period is advantageous for neuro-oncological applications because it can improve distinction between tumour and normal brain tissue, the patient should stay in a calm, darkened area for at least 30 minutes following the injection. In practical practise, a longer scan period of 60 minutes is actually more common since it provides for better contrast between the white and grey matter of the cortex while still providing enough counts for acceptable picture quality. • The patient should be properly positioned when enough uptake time has passed, aligning the orbital-meatal plane in the x-axis and the median sagittal plane in the y-axis (Stanescu, 2016).
Orbital-meatal plane B) Median sagittal plane. Adapted from (Stanescu, 2016).
A 6-year-old boy's normal FDG uptake patterns. The basal ganglia, thalami, and cortical grey matter of the brain exhibit symmetrically high FDG uptake in axial PET images (top row) and combined axial PET and CT images (bottom row). Adapted from (Stanescu, 2016).
Brain abscess • As the degree of absorption is based on the greater metabolic rate of the region of enhanced inflammatory cell migration, FDG PET more accurately depicts the degree of inflammatory response in brain abscesses than enhancement in CT or MRI (Santiago, 2015).
Brain abscess • Frontal lobe mass with FDG showing rim (intensified on the CT) central necrosis, and decreased FDG activity in the adjacent cortex due to edema may be seen on PET/CT (arrow) (Juweid and Hoekstra, 2011).
Parkinson’s disease. • The term "PD-related pattern" (PDRP) refers to a disease-specific pattern of glucose metabolism. The lateral premotor and prefrontal cortices, posterior parietal association cortex, occipital primary visual areas, and primary motor cortex all exhibit a relative decrease in metabolism while the putamen and globuspallidus, thalamus, pons, and primary motor cortex exhibit a relative increase in metabolism. • Evaluation of cognitive impairment in PD-associated syndromes, such as Parkinson's disease dementia (PDD) or PD-mild cognitive impairment (PD-MCI), is another effective application of [18F]FDG-PET. Visual associative, posterior cingulate, and caudate nucleus metabolic alterations are clearly associated with the development of a cognitive impairment (Fraioli, 2019).
Parietal and occipital brain metabolism in a typical Parkinson's disease patient was reduced in FDG-PET pictures (arrows). Adapted from (Fraioli, 2019).
References • Fraioli, F. (2019) PET/CT in Brain Disorders. PET/CT 1st 2019. edn. Cham: Springer International Publishing. • Juweid, M. E. and Hoekstra, O. S. (2011) Positron Emission Tomography. Methods in Molecular Biology, 727 1st 2011. edn. Totowa, NJ: Humana Press. • Papanicolaou, A. C. (2014) The Oxford handbook of functional brain imaging in neuropsychology and cognitive neurosciences. Oxford library of psychology New York: Oxford University Press. • Santiago, J. F. Y. (2015) Positron Emission Tomography with Computed Tomography (PET/CT). 1st 2015. edn. Cham: Springer International Publishing.