
Measures of Position - Quartiles
E N D
Presentation Transcript
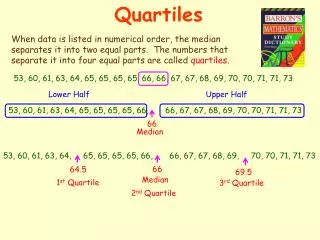
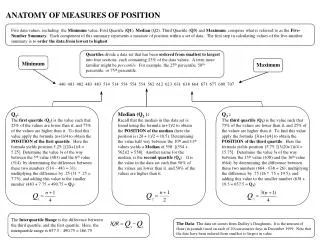
Measures of Position - Quartiles The three quartiles Q1, Q2, and Q3 approximately divide an ordered data set into four equal parts. About ¼ of the data falls on or below the first quartile Q1. About ½ of the data falls below the second quartile Q2., and about ¾ of the data falls below the third quartile Q3. The second quartile has the same median of the data set
Measures of Position - Quartiles • To find the quartiles: • Order the data • Find Q2: • If there is an odd number of data points, find the center data point, Q2 • If there are an even number of data points, find the center gap, and average the numbers on either side of the gap.
Measures of Position - Quartiles • To find the quartiles: • Find Q1: • If there is an odd number of data points below Q2, find the center data point, and call it Q1 • If there are an even number of data points below Q2, find the center gap, and average the numbers on either side of the gap, and label it Q1. • Find Q3: • If there is an odd number of data points above Q2, find the center data point, and call it Q3 • If there are an even number of data points above Q2, find the center gap, and average the numbers on either side of the gap, and label it Q3.
Measures of Position - Quartiles • The interquartile Range (IQR) equals Q3 – Q1. • An outlier is defined as: • Any value that is more than 1.5 times the IQR above Q3 or • Any value that is less than 1.5 times the IQR below Q1
Measures of Position - Quartiles • To make a box and whisker plot: • Make a number line and label Q1, Q2, and Q3 • Make a rectangular box using Q1 and Q3 as ends • Mark a vertical line at Q2 • Mark the minimum and maximum data points • Draw a horizontal line from the minimum point to Q1. • Draw a horizontal line from Q3 to the maximum point
Measures of Position - Quartiles • Make a box-and-whisker plot of the following data, and identify any outliers: • 5, 6, 4, 6, 3, 7, 5, 3, 4, 5, 6, 5, 3, 2, 4, 4, 4 • First, order the data: • 2, 3, 3, 3, 4, 4, 4, 4, 4, 5, 5, 5, 5, 6, 6, 6, 7 • Find the center data point:
Measures of Position - Quartiles • Make a box-and-whisker plot of the following data, and identify any outliers: • 5, 6, 4, 6, 3, 7, 5, 3, 4, 5, 6, 5, 3, 2, 4, 4, 4 • First, order the data: • 2, 3, 3, 3, 4, 4, 4, 4, 4, 5, 5, 5, 5, 6, 6, 6, 7 • Find the center data point: 4 • Find Q1:
Measures of Position - Quartiles • Make a box-and-whisker plot of the following data, and identify any outliers: • 5, 6, 4, 6, 3, 7, 5, 3, 4, 5, 6, 5, 3, 2, 4, 4, 4 • First, order the data: • 2, 3, 3, 3, 4, 4, 4, 4, 4, 5, 5, 5, 5, 6, 6, 6, 7 • Find the center data point: 4 • Find Q1: have to average 3 and 4, giving 3.5 • Find Q3:
Measures of Position - Quartiles • Make a box-and-whisker plot of the following data, and identify any outliers: • 5, 6, 4, 6, 3, 7, 5, 3, 4, 5, 6, 5, 3, 2, 4, 4, 4 • First, order the data: • 2, 3, 3, 3, 4, 4, 4, 4, 4, 5, 5, 5, 5, 6, 6, 6, 7 • Find the center data point: 4 • Find Q1: have to average 3 and 4, giving 3.5 • Find Q3: have to average 5 and 6, giving 5.5
Measures of Position - Quartiles • Make a box-and-whisker plot of the following data, and identify any outliers: • 5, 6, 4, 6, 3, 7, 5, 3, 4, 5, 6, 5, 3, 2, 4, 4, 4 • First, order the data: • 2, 3, 3, 3, 4, 4, 4, 4, 4, 5, 5, 5, 5, 6, 6, 6, 7 • Find the center data point: 4 • Find Q1: have to average 3 and 4, giving 3.5 • Find Q3: have to average 5 and 6, giving 5.5 • Find the IQR:
Measures of Position - Quartiles • Make a box-and-whisker plot of the following data, and identify any outliers: • 5, 6, 4, 6, 3, 7, 5, 3, 4, 5, 6, 5, 3, 2, 4, 4, 4 • First, order the data: • 2, 3, 3, 3, 4, 4, 4, 4, 4, 5, 5, 5, 5, 6, 6, 6, 7 • Find the center data point: 4 • Find Q1: have to average 3 and 4, giving 3.5 • Find Q3: have to average 5 and 6, giving 5.5 • Find the IQR: Q3 – Q1 = 5.5 – 3.5 = 2.0
Measures of Position - Quartiles • A number is an outlier if it is more than 1.5 times the IQR above Q3. • 1.5 * 2 = 3 • Q3 + 1.5 * IQR = 5.5 + 3 = 8.5, so the 7 is not an outlier. • Had the 7 been larger than 8.5, it would have been classified as an outlier.
Measures of Position - Quartiles • A number is an outlier if it is more than 1.5 times the IQR below Q1. • Q1 - 1.5 * IQR = 3.5 - 3 = 0.5, so the 2 is not an outlier. • Had the “2” been less than 0.5, it would have been an outlier.
Homework • Pg 90, # 7 – 19 odd (7)