Measures of Position
380 likes | 1.03k Views
Measures of Position. Section 3.4. Identify the position of a data value in a data set, using various measures of position such as percentiles, deciles, and quartiles . Objectives. Are used to locate the relative position of a data value in a data set

Measures of Position
E N D
Presentation Transcript
Measures of Position Section 3.4
Identify the position of a data value in a data set, using various measures of position such as percentiles, deciles, and quartiles Objectives
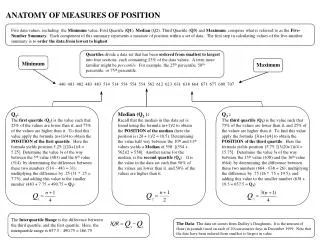
Are used to locate the relative position of a data value in a data set • Can be used to compare data values from different data sets • Can be used to compare data values within the same data set • Can be used to help determine outliers within a data set • Includes z-(standard) score, percentiles, quartiles, and deciles Measures of Position (or Location or Relative Standing)
Can be used to compare data values from different data sets by “converting” raw data to a standardized scale • Calculation involves the mean and standard deviation of the data set • Represents the number of standard deviations that a data value is from the mean for a specific distribution • We will use z-scores extensively in Chapter 6 Z score or Standard Score
Is obtained by subtracting the mean from the given data value and dividing the result by the standard deviation. • Symbol of BOTH population and sample is z • Can be positive, negative or zero • A date point can be considered unusual if its z-score is sufficiently large or small • Formula • Population • Sample Z-Score
Are position measures used in educational and health-related fields to indicate the position of an individual in a group • Divides the data set in 100 (“per cent”) equal groups • Used to compare an individual data value with the national “norm” • Symbolized by P1, P2 ,….. • Percentile rank indicates the percentage of data values that fall below the specified rank Percentiles
Thad scored 22 on the ACT. What is his percentile rank? • Ansley scored 20 on the ACT. What is her percentile rank? Examples
Step 1: Arrange data in order from lowest to highest • Step 2: Substitute into the formula where n is total number of values and p is given percentile • Step 3: Consider result from Step 2 • If c is NOT a whole number, round up to the next whole number. Starting at the lowest value, count over to the number that corresponds to the rounded up value • If c is a whole number, use the value halfway between the cth and (c+1)stvalue when counting up from the lowest value Finding a Data Value Corresponding to a Given percentile
To be in the 90th percentile, what would you have to score on the ACT? Find P85 Examples
Same concept as percentiles, except the data set is divided into four groups (quarters) • Quartile rank indicates the percentage of data values that fall below the specified rank • Symbolized by Q1 , Q2 , Q3 • Equivalencies with Percentiles: • Q1 = P25 • Q2 = P50 = Median of data set • Q3 = P75 Quartiles Minitab calculates these for you.
Same concept as percentiles, except divides data set into 10 groups • Symbolized by D1 , D2 , D3 , … D10 • Equivalencies with percentiles • D1 = P10 D2 = P20 …….. • D5 = P50 =Q2 =Median of Data Set Deciles
Outlier is an extremely high or an extremely low data value when compared with the rest of the data values • A data set should be checked for “outliers” since “outliers” can influence the measures of central tendency and variation (mean and standard deviation) Outliers
Interquartile Range (IRQ) • Q3-Q1 • Indentifying Outliers (p. 149) • Is the data point between Identifying Outliers
Emily scored 11 on the ACT. Would her score be considered an outlier? • Danielle scored 38 on the ACT. Would her score be considered an outlier? Examples
Data value may have resulted from a measurement or observational error • Data value may have resulted from a recording error • Data value may have been obtained from a subject that is not in the defined population • Data value might be a legitimate value that occurred by chance (although the probability is extremely small) Why Do Outliers Occur?