Download

1 / 14
160 likes | 380 Views
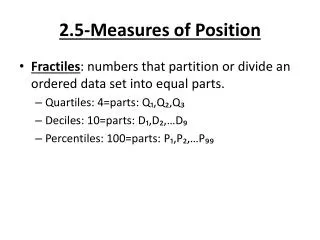
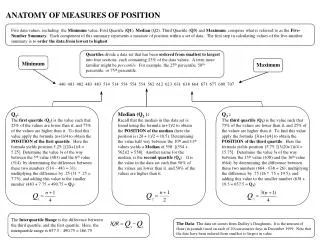
2.5 Measures of Position. I. Quartiles. Fractiles : numbers that partition or divide an ordered data set into equal parts Quartiles : divide data into 4 equal parts with 3 quartiles Q1, Q2, & Q3 IQR (Interquartile Range): Q3 – Q1. Example 1. Find the quartiles and the IQR.

E N D
I. Quartiles • Fractiles: numbers that partition or divide an ordered data set into equal parts • Quartiles: divide data into 4 equal parts with 3 quartiles Q1, Q2, & Q3 • IQR (Interquartile Range): Q3 – Q1
Example 1 • Find the quartiles and the IQR. 13, 9, 18, 15, 14, 21, 7, 10, 11, 20, 5, 18, 37, 16, 17
Now let’s do one with a calculator! • STAT – Edit (Type data into L1) • STAT – Calc – 1Var-Stats L1 • Scroll down 23, 25, 30, 23, 20, 22, 21, 15, 25, 24, 30, 25, 30 20, 23, 29, 20, 19, 22, 23, 29, 23, 28, 22, 28
Box-and-Whisker Plot: Exploratory data analysis tool that highlights the important features of a data set. To make one you need to know the… • Five Number Summary: Minimum, Quartile 1, Median, Quartile 3, Maximum Always put a number line under it!
Make a box and whisker plot • For example 1 • For example 2
Practice • Classwork: Pg 100-101 #1, 3, 11, 19 • Homework: Pg 100 – 101 #2, 4, 12, 20
2.5 continues… Measures of Position
II. Percentiles & Other Fractiles • Deciles: Divide data into 10 parts with D1 – D9 • Percentiles: divide data into 100 parts with P1 – P99 • Q1 = P25 • Q2 = D5 = P50 (think $) • Percentiles are often used in the health and education fields
Page 97 • Let’s look at example 5 • Let’s do example 6
III. The Standard Score • Standard score represents the number of standard deviations a value is from the mean. • z = or z = • Z score can be positive, negative or zero. • A z-score is considered unusual if it is more than 2 standard deviations above or below the mean. • You can use a z-score to compare data values from different sets. It allows you to compare apples and oranges
Practice • Classwork: Pg 102 #25, 27, 29, 33, 35, 37 • Homework: Pg 102 # 26 – 38 even (skip #32)