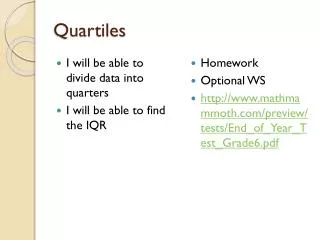
Quartiles
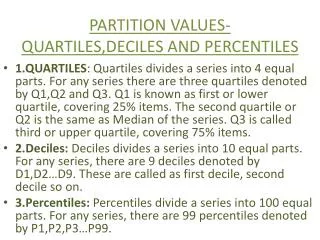
Quartiles. What are they?. What is a Quartile?. There are 3 types of Quartiles: The Quartile The Upper Quartile The Lower Quartile A Quartile is the median of an ordered data set. The Upper Quartile is the median of the upper (higher) half of the data set.


Quartiles
E N D
Presentation Transcript
Quartiles What are they?
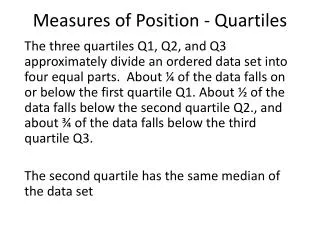
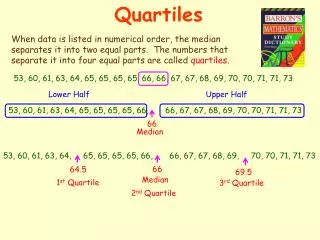
What is a Quartile? • There are 3 types of Quartiles: • The Quartile • The Upper Quartile • The Lower Quartile • A Quartile is the median of an ordered data set. • The Upper Quartile is the median of the upper (higher) half of the data set. • The Lower Quartile is the median of the lower half of the data set. • There is also the Interquartile Range, which is the difference between the Upper and the Lower Quartiles.
Why? • This information is used to compare the statistics of different examples. • The most common use for this that you would know is SPORTS. This is how people predict what teams are going to win and what teams are going to lose in a given season.
What can you tell from this Data? • A higher mean indicates a higher average per game or per player, depending on the information. • A higher range indicates data that is more spread out, therefore less reliable or consistent. • A higher interquartile range indicates more variation in the middle of the data, which means that the data is less consistent or more varied. • Teams with a higher interquartile range are usually less consistent in a given season, meaning they are more likely to lose.
Example: • The data set below give the number of home runs by each player on the Bears and Wildcats during a season of the Oakmont Baseball League. Compare the data using the mean, median, range, and interquartile range. • Bears: • 28, 25, 21, 19, 18 ,14, 10, 8, 7, 5, 3, 2 • Wildcats: • 20, 19, 18, 16, 15, 15, 12, 11, 9, 8, 6, 5, 4
Bears Statistics • Mean: • (28+25+21+19+18+14+10+8+7+5+3+2)/12= 160/12=13.3 • Median: • (14+10)/2=24/2=12 • Range: • 28-2=26
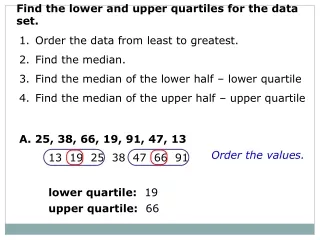
How to find Quartiles • Lower Quartile: • Once the numbers are listed in order from smallest to biggest, divide the data set down the middle (if there is an odd number of data, use the numbers below for lower and the numbers above for upper and omit the median itself). • So, for the set of data for the Bears: • 2, 3, 5, 7, 8, 10, 14, 18, 19, 21, 25, 28 Lower Quartile • Find the median of this lower set: (7+5)/2=12/2=6
Upper Quartile: • Once the numbers are in order from smallest to largest, divide the data set in half (using the same rules as the last slide) and find the median of the upper set of data. • So for the Bears: • 2, 3, 5, 7, 8, 10, 14, 18, 19, 21, 25, 28 Upper Quartile • Find the median: (19+21)/2=40/2=20
How to find the Interquartile Range • Take the upper quartile that you just found and subtract the lower quartile that you just found. 20-6=14 • So, to sum up the data we have found for the Bears:
Wildcats Statistics • 4, 5, 6, 8, 9, 11, 12, 15, 15, 16, 18, 19, 20 • Mean: (4+5+6+8+9+11+12+15+15+16+18+19+20)/13=12.2 • Median: 12 • Range: 20-4=16 • Lower Quartile: (8+6)/2=14/2=7 • Upper Quartile: (18+16)/2=34/2=17 • Interquartile Range: 17-7=10
What does this all mean? • Well, the Bears’ mean is greater than the Wildcats’ mean, so the Bears averaged more home runs per player than the Wildcats. • The Wildcats’ range is less than the Bears’ range, so their data is less spread out than the Bears data. • The Wildcats’ interquartile range is less than the Bears’ interquartile range, so the Wildcats’ middle 50% of the data showed less variation than the middle 50% of the Bears’ data. • So who would you think is more likely to win a game between these two teams? Why?
Comparing Sample and Population Statistics • At the end of the season, summary home runs for the Oakmont Baseball League were posted. The table on the next slide shows the summary data for the Bisons, the Tigers, and for the entire league. Find the averages of the summary statistics from the four samples: Bears, Wildcats, Bisons, Tigers. Then compare them to the population measure (the league).
Solution • Average Mean of the 4 Teams: (13.3+12.2+10.5+13.4)/4=49.4/4=12.35 • Average Median of the 4 teams: (12+12+11.5+13)/4=48.5/4=12.125 • Average Range of the 4 Teams: (26+16+22+26)/4=90/4=22.5 • Average Interquartile Range of the 4 Teams: (14+10+14.5+16.5)/4=55/4=13.75
Comparison • The average mean and median are more than the population measure, which is the league. • The average range and interquartile range are less than the corresponding population measures. • So were these 4 teams more or less consistent than the rest of the league? Why do you think that?
Classwork • Student Text Book pages 347-351 ALL
Homework • Assignments and Skills Practice Book • Pages 566-569 11-22 • Pages 572-576 1-8 • I promise it is not as bad as it looks!