Download
1 / 1
10 likes | 87 Views
Learn about the concept of the five-number summary, including minimum, quartiles, median, and maximum, with step-by-step calculations using a data set from Dudley’s Doughnuts in December 1999. Understand quartiles and positions in data analysis.

E N D
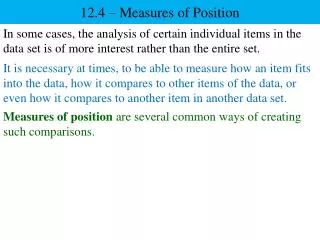
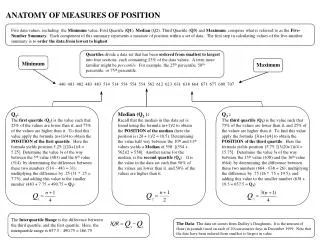
ANATOMY OF MEASURES OF POSITION Five data values, including the Minimum value, First Quartile (Q1), Median (Q2), Third Quartile (Q3) and Maximum, comprise what is referred to as the Five-Number Summary. Each component of this summary represents a measure of position within a set of data. The first step in calculating values of the five-number summary is to order the data from lowest to highest. Quartiles divide a data set that has been ordered from smallest to largest into four sections, each containing 25% of the data values. A term more familiar might be percentile. For example, the 25th percentile, 50th percentile, or 75th percentile. Minimum Maximum 440 481 482 483 483 514 514 554 554 554 562 612 623 631 638 664 671 677 690 707 Q1: The first quartile (Q1) is the value such that 25% of the values are lower than it, and 75% of the values are higher than it. To find this value apply the formula (n+1)/4 to obtain the POSITION of the first quartile. Here the formula yields position 5.25: [(20+1)/4 = 5.25]. Determine the value ¼ of the way between the 5th value (483) and the 6th value (514) by determining the difference between these two numbers (514 – 483 = 31); multiplying the difference by .25 (31 * .25 = 7.75); and adding this value to the smaller number (483 + 7.75 = 490.75 = Q1). Median (Q2 ): Recall that the median in this data set is found using the formula (n+1)/2 to obtain the POSITION of the median (here the position is (20 + 1)/2 = 10.5). Determining the value half way between the 10th and 11th values yields a Median of 558: [(554 + 562)/2 = 558]. Another name for the median, is the second quartile (Q2) . It is the value in the data set such that 50% of the values are lower than it, and 50% of the values are higher than it. Q3 : The third quartile (Q3) is the value such that 75% of the values are lower than it, and 25% of the values are higher than it. To find this value apply the formula [3(n+1)/4] to obtain the POSITION of the third quartile. Here the formula yields position 15.75: [(3(20+1))/4 = 15.75]. Determine the value ¾ of the way between the 15th value (638) and the 16th value (664) by determining the difference between these two numbers (664 - 638 = 26); multiplying the difference by .75 (26 * .75 = 19.5); and adding this value to the smaller number (638 + 19.5 = 657.5 = Q3) The Interquartile Range is the difference between the third quartile, and the first quartile. Here, the interquartile range is 657.5 - 490.75 = 166.75 The Data: The data set comes from Dudley’s Doughnuts. It is the amount of flour (in pounds) used on each of 20 consecutive days in December 1999. Note that the data have been ordered from smallest to largest in value.