Download
1 / 25
250 likes | 399 Views
This review explores demographic transition theory, highlighting economic and cultural changes that result in declining birth and death rates as nations industrialize. It examines the ecological footprint, discussing how wealth disparities affect resource consumption, particularly in developed versus developing countries. As population growth exerts pressure on the environment, factors like female education and family planning emerge as viable solutions to manage fertility rates and ensure sustainable development. It addresses challenges like HIV/AIDS and emphasizes the importance of expanding women’s rights in facilitating demographic transition.

E N D
Review: The Ecological Footprint The cumulative amount of Earth’s surface area required to provide the raw materials a person or a population consumes and to dispose of or recycle the waste that is produced
Ecological footprints Residents of some countries consume more resources—and thus use more land—than residents of others. Shown are ecological footprints of an average citizen from various nations. Figure 7.23
The wealth gap Residents of developed nations have larger houses, more possessions, and more money than residents of developing nations. The richest 20% of the world’s people consumes 86% of its resources, and has >80 times the income of the poorest 20%. Figure 7.25
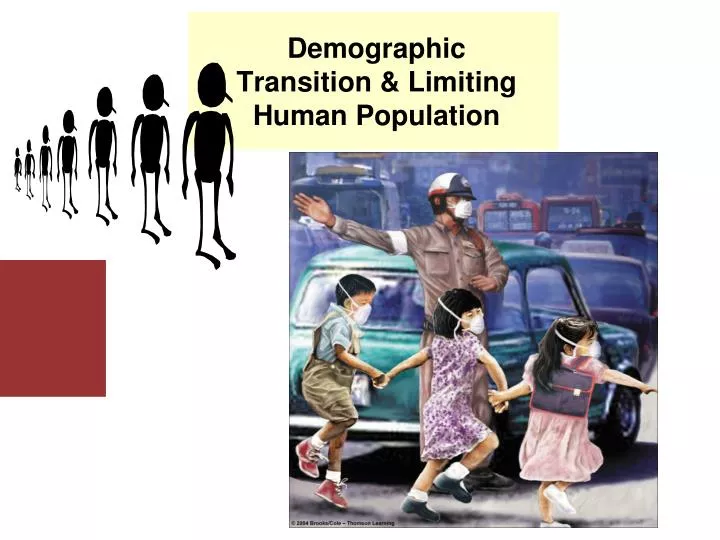
Demographic transition theory Demographic transition = model of economic and cultural change to explain declining death rates, declining birth rates, and rising life expectancies in Western nations as they became industrialized Proposed by F. Notestein in the 1940s-1950s
Demographic transition: Stages Figure 7.18
Demographic transition: Stages The demographic transition consists of several stages: Pre-industrial stage: high death rates and high birth rates Transitional stage: death rates fall due to rising food production and better medical care. Birth rates remain high, so population surges. Industrial stage: birth rates fall, as women are employed and as children become less economically useful in an urban setting. Population growth rate declines. Post-industrial stage: birth and death rates remain low and stable; society enjoys fruits of industrialization without threat of runaway population growth.
A Proven Solution: Female Education Female literacy and school enrollment are correlated with total fertility rate: **More-educated women have fewer children. Figure 7.16
Family planning and Total Fertility Rate (TFR) Family planning, health care, and reproductive education can lower TFRs. A counselor advises African women on health care and reproductive rights. Figure 7.17b
Family planning and Fertility Rate Nations that invested in family planning (green) reduced TFRs more than similar nations that did not (red). Figure 7.17a
Limiting Factors (if we don’t implement a solution, the population will control itself in a much more dramatic way - Malthus) • Limiting Factor: anything that restricts the growth of a population in a biological community • Density-Dependent: relies on the number of people • Ex. Food/famine, clean water, shelter, build up of trash/toxic waste, pollution, plague/disease, stress, war, etc. • Density-Independent: unrelated to the number of people • Ex. Weather, climate, natural disasters, etc.
HIV/AIDS and human population AIDS cases are increasing rapidly worldwide. Figure 7.26
HIV/AIDS and human population Infects 1 in 5 people in southern African nations Infects 5 million new people each year Kills babies born to infected mothers Has orphaned 14 million children • Has cut 15 years off life expectancies in parts of southern Africa Figure 7.27
Population and the environment Population growth can lead to environmental degradation. Overpopulation in Africa’s Sahel region has led to overgrazing of semi-arid lands (leads to starvation). Figure 7.21
Demographic fatigue and demographic transition Many governments of developing countries are experiencing “demographic fatigue,” unable to meet the social, economic, and environmental challenges imposed by rapid population growth. This raises the question: Will today’s developing countries successfully pass through the demographic transition?
The “IPAT” model Shows how Population, Affluence, and Technology interact to create Impact on our environment. • I = P A T Further factors can be added to the original equation of Holdren and Ehrlich to make it more comprehensive.
Conclusions: Challenges • Human population is rising by 79 million people annually. • Many more people are born into poverty than into wealth. • Rich and poor nations are divided by a “wealth gap.” • HIV/AIDS is taking a heavy toll. • Population growth has severe environmental effects.
Conclusions: Solutions • Expanding women’s rights is crucial to encourage the demographic transition. • Health and reproductive education and counseling can reduce fertility rates. • Education, medicine, and policies can lessen the toll of HIV/AIDS. • New “green” technologies can help reduce population growth’s environmental impacts & increase our carrying capacity.
QUESTION: Review What has allowed us to increase Earth’s carrying capacity for our species? a. Agriculture b. Industrialization c. Tool-making d. All of the above
QUESTION: Review Women who are more educated tend to… ? a. Have higher TFRs. b. Live in developing nations. c. Have fewer children. d. Contract HIV/AIDS.
QUESTION: Weighing the Issues Should the United States fund family planning efforts in other nations? a. Yes, without reservation b. Yes, in nations whose programs it approves c. Only if it can influence the nations’ policies d. Never under any circumstances
QUESTION: Interpreting Graphs and Data What happens during the “transitional stage” of the demographic transition?a. Birth rates rise; death rates drop; population increases b. Birth rates drop; death rates drop; population decreases c. Death rates drop; birth rates are stable; population increases Figure 7.18
QUESTION: Viewpoints Do you believe that national governments should implement policies, subsidies, or other programs to reduce birth rates? a. No, not at all b. Yes, but only positive incentives for fewer children c. Yes—penalties for too many children d. Yes, both incentives and penalties
Central Case: China’s One-Child Policy • Unfettered population growth posed challenges for China’s environment, economy, and political stability. • China tried to control its growth with a system of rewards and punishments to encourage one-child families. • The program decreased population growth, but meant government intrusion in private reproductive choices.
Assignment for “China’s Lost Girls” You must identify 5 Key Facts AND 5 Unforeseen Consequences of China’s One-Child Policy On a sheet of notebook paper: • Title your paper “China’s Lost Girls” and write your name and class period in the top right. • Title one section “Key Facts” & number #1-5. • Title another section “Unforeseen Consequences” & number #6-10. • Fill in these sections with information from the documentary “China’s Lost Girls”