HUMAN POPULATIONS
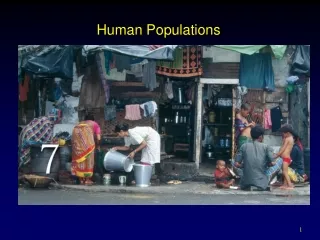
HUMAN POPULATIONS. HUMAN POPULATIONS. Every second, on average, 4-5 children are born somewhere on earth. In that same second, 2 other people die. This difference between births and deaths means a net gain of nearly 2.5 people per second in the world’s population. 9000 people per hour


HUMAN POPULATIONS
E N D
Presentation Transcript
HUMAN POPULATIONS • Every second, on average, 4-5 children are born somewhere on earth. In that same second, 2 other people die. This difference between births and deaths means a net gain of nearly 2.5 people per second in the world’s population. • 9000 people per hour • 214,000 people per day • Over 6 million per month • 78 million per year • If each one stood up, pronounced their name and sat down, it would take 600 years to complete roll call • By 2025 it will take 1,000 years to complete this exercise
HUMAN POPULATIONS World Population Clock Population Ranks U.S. POP Clock Projection
HUMAN POPULATIONS 2013 7.2 ish Billion People
World Population Over the Centuries 9,000 human beings added to the planet every hour
World’s Human Population • The human population hit 1 million about 15,000 years ago. • The human population hit 1 billion in 1804. • 3 billion in 1960 ( 150 years to add 2 billion) • 1 billion people add between 1987-1999 • This means our population will double in about 40 years.
What is Exponential Growth? • Which would you choose? 2 million dollars or 1 penny on day one and then double it each day for 30 days.
Exponential Growth • Exponential growth is marked by doubling. A few doublings can lead quickly to enormous numbers. • It is deceptive because it starts out slowly, but rapidly gets out of hand.
Reasons for the Human Population Explosion Causes of disease recognized Improvements in nutrition Discovery of antibiotics Improvements in medicine Increase in number of women who actually reach child-bearing age Short doubling times in some countries Increased food production Sanitation
What influences Growth rate? • Crude birth rate – the number of births per thousand people. • Crude death rate – the number of deaths per thousand people. • If they are equal, there is zero population growth. • If births is higher than deaths, then the pop. Goes up. • Life expectancy – The average number of years someone is expected to live.
Calculating Fertility Rates and Doubling Times (CBR - CDR)/1000 x 100 = % Rate of Increase or decrease in population per 1000 per year Doubling time- The time it takes for the population to double the number of people 70/ Rate of Increase = Doubling Time
Growth Rate- includes birth rate, death rate, immigration and emigration
Factors Affecting Death Rates • Death rates have declined because of: • Increased food supplies, better nutrition. • Advances in medicine. • Improved sanitation and personal hygiene. • Safer water supplies. • U.S. infant mortality is higher than it could be (ranked 46th world-wide) due to: • Inadequate pre- and post-natal care for poor. • Drug addiction. • High teenage birth rate.
Infant mortality rate- Number of child/infant deaths. If a mother lives in an area with a high infant mortality rate she will tend to have a lot of children to ensure some will make it to adulthood.
Zero Population Growth- When the number of births, equals the number of deaths. No growth in the population. Total Fertility Rate- an estimate of the average number of children a women will have during her childbearing years.
Importance of kids in labor force Urbanization Cost of raising & educating kids Availability of private & public pensions Religious beliefs, traditions & cultural norms Educational & employment opportunities Infant mortality rate Average age at marriage Availability of reliable birth control Factors that affect birth & fertility rates
Replacement-level fertility- the number of children a couple must bear to replace themselves. It is slightly higher than two children per couple. (2.2 in developed countries and as high as 4.5 in some developing countries)It is greater in countries w/ high infant mortality rates than in countries w/ low infant mortality rates
Factors Affecting Birth Rates and Fertility Rates • The number of children women have is affected by: • The cost of raising and educating them. • Availability of pensions. • Urbanization. • Education and employment opportunities. • Infant deaths. • Marriage age. • Availability of contraception and abortion.
Average crude birth rate Average crude death rate 21 World 9 All developed countries 11 10 All developing countries 23 8 Developing countries (w/o China) 27 9 Fig. 9-3, p. 174
Other factors that influence a countries population • Immigration – the migration or movement of people into a country or area to take up permanent residence. • Emigration – the migration or movement of people out of a country. • Net Migration- Total number of people moving into or out of the population.
Work Money Political Safety Freedom of Religion To Escape War Famine For a Better Education Different Government Tolerance Usually people immigrate to start a better life for them or their families. Some come alone in hope that they can soon bring the rest of their family. Others work so they can send money to help those where they came from. Reasons to Immigrate
Case Study: U.S. Immigration • Since 1820, the U.S. has admitted almost twice as many immigrants and refugees as all other countries combined. Figure 9-8
FACTORS AFFECTING HUMAN POPULATION SIZE • Population increases because of births and immigration and decreases through deaths and emigration. • Instead of using raw numbers, crude birth rates and crude death rates are used (based on total number of births or deaths per 1,000 people in a population).
Demographics • Demography – Keeps track of human populations. The data collected is used to show age structures (number of people in various age brackets), and is separated by gender (male and female). Population profiles (graphs) are used to determine age structures (proportions of people in each age bracket), and are used to make predictions of future population trends.
Demographics • A demographer studies vital statistics about people, such as birth rates, death rates, where they live, as well as population size. • They compare country to country, state to state, region to region. • They can predict trends that can be important to plan the future.
Demographics • They study the populations of developed countries and non-developed countries. • Developed countries are those that are industrialized and/or have high standards of living. • Less-developed countries are those that have very little industrialization and/or low standards of living.
Developed High literacy rates High standards of living Low birth rate Low death rate Slow or Zero population growth High life expectancy Rich High per capita High Energy Consumption Urban populations Less-Developed Low literacy rates Low standard of living High birth rate High death rate Rapid population growth Low life expectancy Poor Widespread Disease Low per capita Rural populations Demographics
Economic Categories Based on Per Capita Gross National Income Gross National Product (GNP)- The most commonly used measure of the economic growth of a country. per capita – takes into relation countries population High-income, highly developed, industrialized countries United States, Japan, Canada Average GNI per capita = $26,710 Middle-income, moderately developed countries Latin America, South Africa, China Average GNI per capita = $1,850
Economic Categories Based on Per Capita Gross National Income Low-income, developing countries Western and central Africa, India, central Asia Average GNI per capita = $430
Major Economic Divisions of the World Gross national income/capita
Disparities Developed countries 15% of the world’s population Control 80% of the world’s wealth Low-income developing countries 37% of the world’s population Control 3.0% of the world’s gross national income Difference in per capita income: 63 to 1!
Stabilizing Population and Eradicating Poverty • Universal primary education • Eradication of adult illiteracy • School lunch programs for 44 poorest countries • Assistance to preschool children and pregnant women in 44 poorest countries • Reproductive health care and family planning services Total Additional Annual Cost = $77 billion Photo Credit: iStockPhoto / Wallenrock
Poor (less developed) countries have high population growth rates therefore, high populations. More developed (richer) countries have little or no population growth.
Histograms • These population histograms show the age distribution and help predict the age dist. for the future. 10 years later
The age structure histogram below shows the percentage of population for both male (left) and female (right) for three nations, Mexico (rapid growth), U.S. (slow growth) and Sweden (zero growth). The shaded areas on each graph show people in their child bearing years.
Age structure- Percentage of the population at each age level in a populationGeneration time- the time it takes for 1 generation to pass.
POPULATION AGE STRUCTURE • The number of people in young, middle, and older age groups determines how fast populations grow or decline. • The number of people younger than age 15 is the major factor determining a country’s population growth. • Changes in the distribution of a country’s age groups have long-lasting economic and social impacts.
POPULATION AGE STRUCTURE • Populations with a large proportion of its people in the preproductive ages 1-14 have a large potential for rapid population growth. Figure 9-9
U.S. Statistics • Because of the ‘Baby Boom’ the US has a bulge in the pyramid with people in their 50’s-60’s. • There are also more women than men in the older age group because of differences in longevity between the sexes. (Cont…)