Download
1 / 25
250 likes | 429 Views
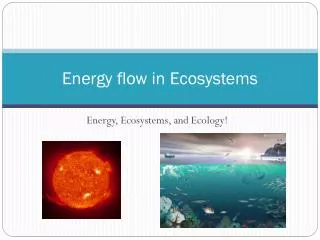
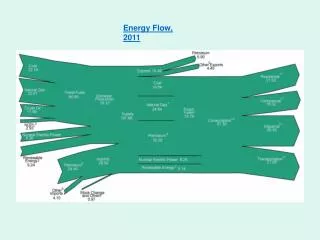
Outline 3-2: Energy Flow. I. Primary Productivity. A. The rate at which organic material is produced by photosynthesis in an ecosystem. 1. Determines the amount of energy available in an ecosystem

E N D
I. Primary Productivity A. The rate at which organic material is produced by photosynthesis in an ecosystem. 1. Determines the amount of energy available in an ecosystem 2. Other organisms are limited by this initial amount of energy
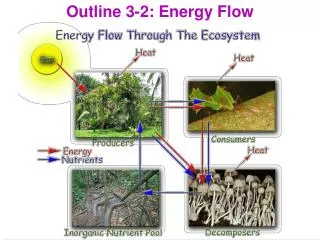
II. Trophic Levels A. Organisms are assigned to a particular level in an ecosystem based on their source of energy 1. What an organism eats and what it is eaten by B. Three main levels: 1. Producers 2. Consumers 3. Decomposers
C. Producers 1. Autotrophs who use energy from environment to assemble organic molecules from inorganic molecules. 2. There are 2 types of autotrophs based on type of energy used. Those that do: a. Photosynthesis - use sunlight b. Chemosynthesis - use energy in bonds of chemicals
Photosynthesis Done by plants on land, algae in water & photosynthetic bacteria
2. Consumers a. Heterotrophs that need to feed on other organisms to obtain energy b. Levels: Primary consumers - eat producers rabbits, mice, etc. Secondary consumers - eat primary consumers wolf, coyote, lion, snake Tertiary consumers - eat secondary consumers hawks, eagles, etc.
c.Consumersclassified by type of food eaten: Herbivores - eat producers Carnivores - eat consumers Omnivores - eat both producers & consumers Detritivores - feed on organic wastes & dead bodies
3. Decomposers a. Cause decay of dead bodies & their waste back into inorganic minerals b. Recycle nutrients back into soil & water for producers to use. c. Fungi & bacteria are examples
III. Paths of Energy Flow A. Food Chain 1. Specific sequence in which organisms obtain energy in an ecosystem a. Producers consumer levels decomposers Grass grasshopper mouse snake hawk (decomposers frequently left out of food chain lists)
In some marine food chains, the producers are microscopic algae and the top carnivore is four trophic levels from the producer.
B. Food Web 1. A diagram of all the many inter- connected food chains in an ecosystem
Feeding Relationships • This food web shows some of the feeding relationships in a salt-marsh community.
IV. Energy is Lost in Ecosystems A. Energy Transfer 1. An animal eating a plant is acquiring energy a. Some of this energy is turned into new tissues in the animal b. Some helps the deer in its activities: running, eating, etc. c. Most (almost half) is lost as heat to the environment after the process of cellular respiration is complete Heat is not useful energy
B.Amount of Energy Lost 1. Plants store about ½ of energy they capture from sun. 2. Herbivores turn about 10% of the energy they consume into their own body tissue 3. About 90% of the energy that carnivores consume is used up & lost as useful energy for other organisms (Same concept as #2 in reverse) Only about 10% of the energy stored in one trophic level is transferred to organisms in the next trophic level
C.Energy Pyramids 1. Diagram which shows each trophic level as a block stacked on top of other blocks. a. Width of each block is related to amount of energy in all the organisms at that level 2. Usually shaped like a pyramid because higher trophic levels have less energy
0.1% Third-level consumers • Energy Pyramid: • Shows the relative amount of energy available at each trophic level. • Only part of the energy that is stored in one trophic level is passed on to the next level. 1% Second-level consumers 10% First-level consumers 100% Producers
D.Other Kinds of Pyramids 1. Numbers pyramids a.Compares numbers of organisms at each trophic level b. May not be pyramid shaped 2. Biomass pyramids a. Compares amount of biomass at each level Biomass is total dry weight of organisms
Ecological Pyramids Pyramid of Numbers: Shows the relative number of individual organisms at each trophic level.
Ecological Pyramids Biomass Pyramid: Represents the amount of living organic matter at each trophic level. Typically, the greatest biomass is at the base of the pyramid. 50 grams of human tissue 500 grams of chicken 5000 grams of grass
E.Trophic Levels are Limited 1. Most ecosystems on land involve only 3 or 4 trophic levels 2. This is due to the progressive loss of energy at each transfer 3. Eventually there is not enough energy left to support a large population of organisms at the next higher level 4. Eating lower on the food chain is more energy efficient a. Eating plants instead of meat would support more people on Earth