Download
1 / 84
840 likes | 1.04k Views
Zobrazovac í techniky na bázi RTG a g záření. Motto: Světlo, i když prochází špínou, se neznečišťuje. sv. Augustin. Nabité částice jsou předurčeny pro měření hloubkové distribuce Fotony (RTG a g ) k tomu, aby se využívaly k zobrazování. Zdroje záření RA zářič RTG trubice

E N D
Zobrazovací techniky na bázi RTG a g záření Motto: Světlo, i když prochází špínou, se neznečišťuje. sv. Augustin
Nabité částice jsou předurčeny pro měření hloubkové distribuce Fotony (RTG a g) k tomu, aby se využívaly k zobrazování Zdroje záření RA zářič RTG trubice brzdné + charakteristické záření (při dopadu e- za anodou) Brzdné záření silně dopředné mc2/Ee Strictly speaking, bremsstrahlung refers to any radiation due to the acceleration of a charged particle, which includes synchrotron radiation; however, it is frequently used (even when not speaking German) in the more literal and narrow sense of radiation from electrons stopping in matter. Zdroj: LINAC se zacílí na kus hmoty s velkým Z a elektrony se zastaví Synchrotronové záření (to samé, jen historický název) Zdroje fotonů
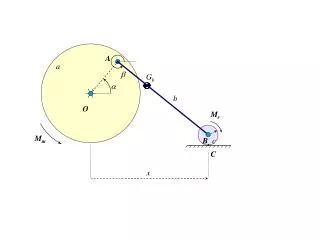
Při nárůstu rychlosti ionizace rychle klesá Minimum je v oblasti γβ ≈ 3-4, tedy β ≈ 0.95c, Ee ≈ 10-20m0c2 Nárůst při dalším zvětšování energie je pozvolnější Ionizační a radiační ztráty částic Bethe-Blochova formule e- těžké částice brzdné záření
Důležitý parametr λu / 2pR λu - perioda magnetu, R poloměr oblouku v magnetu Syn. záření se generuje ve Wigleru Undulatoru Cyclotron uses a constant B and frequency applied electric field (one of these is varied in the synchrocyclotron) Synchrotron - both of these fields are varied. By increasing these parameters appropriately as the particles gain energy, their path can be held constant as they are accelerated Synchrotronové záření
Undulator • consists of a periodic structure of dipole magnets • The static B is alternating along the length of the undulator with a period λu; e- traversing the periodic magnet structure are forced to undergo oscillations and radiate. The radiation produced is very intense and concentrated in narrow energy bands in the spectrum and also collimated on the orbit plane ofelectrons. • For the oscillation amplitude of the motion is small and the radiation displays interference patterns which lead to narrow energy bands. • For an undulator with N periods, the brightness can be up to N2 more than a bending magnet 1: magnets, 2: e beam, 3: synchrotron radiation
Wiggler • the oscillation amplitude is bigger then in undulator and the radiation contributions from each field period sum up independently, leading to a broad energy spectrum
Jednoduché příklady – rozložení materiálu v trubce, či zjištění „vyplavení“ materálu Aplikace na zobrazování
Tomografie (řecky tomos = řez) = zobrazování v řezech, tedy strukturní zobrazování stavby bez fyzického narušení celku Je to zobrazení rozložení materiálu v rovině zkoumaný objekt je prozářen z mnoha úhlů v jedné rovině - získáme několik set projekcí. Úkolem je zrekonstruovat plošný řez vyšetřovaným objektem K detekci se používají scintilační detektory Složitější případy - tomografie
Ze změřeného rozložení intenzit v jednotlivých směrech chceme rekonstruovat rozložení materiálu f(x,y) Jak na to? Radonova transformace (1917)(je to „podobné“ Fourierově transformaci) Z integrálů přes všechny úsečky (x cos + y sin - t = 0) chceme zpětně najít integrovanou funkci f(x,y) Vezměme si na pomoc Fourierovu transformaci y y0 t R(t,) x x0 t R(t,) t Matematika tomografie – Radonova transformace rovnice přímky je (x cos + y sin - t = 0)
Z integrálů přes všechny úsečky (x cos + y sin - t = 0) chceme zpětně najít integrovanou funkci f(x,y) přejděme do polárních souřadnic: Matematika tomografie – Radonova transformace R(t,) t Fourierova transformace: A zpětná „FT“ v pol. souřadnicích:
1D Radonova transformace = 2D Fourierova transformace f(x,y) Fx,yf = FtR f = Fx,y-1FtR Metoda Fourierovy rekonstrukce Každý software pro zpracování dat z tomografie to musí mít v sobě tuto rekonstrukci Matematika tomografie – Radonova transformace
Zařízení používané k detekci fotonů v tomografických přístrojích Hal Anger sestrojil v r. 1957 A gamma camera consists of one or more flat crystal planes or, detectors, optically coupled to an array of photomultiplier tubes, the assembly is known as a "head", mounted on a gantry. Jako detektor většinou slouží NaI(Tl) scintilátor Gamma (Angerova) kamera stínění
Odbočka - detekce g záření Používané detektory • Polovodičové (Ge) • výborné energetické rozlišení, relativně malá účinnost detekce • Ge(Li), HPGe • Scintilační • horší energetické rozlišení, velká účinnost detekce • NaI(Tl), BGO, BaF2,… • brillance– BrCl3:Ce, LaBr3:Ce
Ge detectory Relative efficiency values are often used for germanium detectors, and compare the efficiency of the detector at 1332 keV to that of a 3 in × 3 in NaI detector (i.e., 1.2×10 −3cps/Bqat 25 cm).
Ge detectory Ge spectrum of a radioactive Am-Be-source
NaI(Tl) BGO (Bi3Ge4O12) – vysoké Z, horší spektrální a časové rozlišení LSO (Lu2SiO5(Ce)) – vysoké Z, dobré rozlišení BaF2 - velmi rychlý BrilLanCe (LaBr3(Ce)) – extrémně dobré energetické rozlišení, velmi rychlé Trošku problém posledních dvou je ale přítomnost stálého radioaktivního pozadí (Ra v krystalech BaF2, 138La ) Scintilační detektory pro g záření
Scintilační detektory Sodiumiodidespectrumof137Cs Sodium iodide spectrum of 60Co
The collimator consists of a thick sheet of lead, typically 1-3 inches thick, with thousands of adjacent holes through it. The individual holes limit photons which can be detected by the crystal to a cone; the point of the cone is at the midline center of any given hole and extends from the collimator surface outward. However, the collimator is also one of the sources of blurring within the image; lead does not totally attenuate incident gamma photons, there can be some crosstalk between holes. Unlike a lens, as used in visible light cameras, the collimator attenuates most (>99%) of incident photons and thus greatly limits the sensitivity of the camera system. Large amounts of radiation must be present so as to provide enough exposure for the camera system to detect sufficient scintillation dots to form a picture. Gamma (Angerova) kamera
The best current camera system designs can differentiate two separate point sources of gamma photons located a minimum of 1.8 cm apart, at 5 cm away from the camera face. Spatial resolution decreases rapidly at increasing distances from the camera face. This limits the spatial accuracy of the computer image: it is a fuzzy image made up of many dots of detected but not precisely located scintillation. This is a major limitation for heart muscle imaging systems; the thickest normal heart muscle in the left ventricle is about 1.2 cm and most of the left ventricle muscle is about 0.8 cm, always moving and much of it beyond 5 cm from the collimator face. To help compensate, better imaging systems limit scintillation counting to a portion of the heart contraction cycle, called gating, however this further limits system sensitivity. Gamma (Angerova) kamera
Gamma (Angerova) kamera The Anger camera uses sets of photomultipliers (PMT). Generally each tube has an exposed face of about 7.6 cm in diameter and the tubes are arranged in hexagon configurations, behind the absorbing crystal. The electronic circuit connecting the photodetectors is wired so as to reflect the relative coincidence of light fluorescence as sensed by the members of the hexagon detector array. All the PMTs simultaneously detect the (presumed) same flash of light to varying degrees, depending on their position from the actual individual event. Thus the spatial location of each single flash of fluorescence is reflected as a pattern of voltages within the interconnecting circuit array. The location of the interaction between the gamma ray and the crystal can be determined by processing the voltage signals from the photomultipliers; in simple terms, the location can be found by weighting the position of each photomultiplier tube by the strength of its signal, and then calculating a mean position from the weighted positions. The total sum of the voltages from each photomultiplier is proportional to the energy of the gamma ray interaction, thus allowing discrimination between different isotopes or between scattered and direct photons.
„pokročilá“ rentgenka Rentgenka a naproti ní umístěný detektor fotonů rotují kolem těla pacienta, přičemž úzký svazek RTG prozařuje vyšetřovanou tkáň - jeho intenzita je detekována a vyhodnocuje se zeslabení paprsku v důsledku absorbce tkání. Z hodnot R(t,) získaných prozařováním pod řadou úhlů se provede rekonstrukce absorbční mapy, čímž vznikne denzitní obraz příčného řezu vyšetřovanou oblastí. Na tomto obraze jsou s vysokým rozlišením zobrazeny struktury uložené v různých hloubkách v organismu. Rentgenová tomografie
funkce f(x,y) je vlastně atenuační faktor RTG tomografie
RTG tomografie • Postupným podélným lineárním posunem pacienta vzhledem k systému rentgenka-detektor můžeme vytvořit řadu příčných řezů, které umístěny vedle sebe vytvářejí trojrozměrný obraz vyšetřované oblasti. • Metoda se nazývá počítačová tomografie CT (Computerized Tomography) • přesný název "rentgenová transmisní počítačová tomografie" (X-ray Trasmission Computerized Tomography) se pro zdlouhavost neujal (počítačová - díky náročnosti rekonstrukce) • Kromě prostorového tomografického zobrazení je hlavní předností CT vůči konvenčním RTG zobrazením podstatně vyšší kontrast – jeschopna rozpoznat a zobrazit i nepatrné rozdíly v součinitelích zeslabení RTG-záření. Je to dáno principem zobrazení transverzálního řezu pomocí úzkého paprsku bez ovlivnění sousedními vrstvami a elektronickou detekcí RTG-záření, která je schopna zachytit jemnější rozdíly a širší rozsah dynamiky, než klasický film. • K výbornému rozlišení přispívají i metody počítačové rekonstrukce a filtrace obrazu (nastavení jasu, kontrastu,...).
The first commercially viable CT scanner was invented by Godfrey Newbold Hounsfield in UK. Hounsfield conceived his idea in 1967, and it was publicly announced in 1972. Allan McLeod Cormack of Tufts University, Mass., USA independently invented a similar process, and both Hounsfield and Cormack shared the 1979 Nobel Prize in Medicine. The original 1971 prototype took 160 parallel readings through 180 angles, each 1° apart, with each scan taking a little over five minutes. The images from these scans took 2.5 hours to be processed by algebraic reconstruction techniques on a large computer. RTG tomografie The very first CT scanner prototype. Invented by Houndsfield at EMI.
Several generations of scanners have been produced, with distinguishing tube-detector configuration and scanning motion The 3rd and 4th generation designs developed at approximately the same time RTG tomografie I. II. ~min III. IV. ~ sec Jednotlivé generace tomografů
In the 1st and 2nd generation designs, the X-ray beam was not wide enough to cover the entire width of the 'slice' of interest. A mechanical arrangement was required to move the X-ray source and detector horizontally across the field of view. After a sweep, the source/detector assembly would be rotated a few degrees, and another sweep performed. This process would be repeated until 360o (180o)had been covered. The complex motion placed a limit on the minimum scan time at approx. 20 sec per image. RTG tomography I. III. IV.
In the 3rd and 4th generation designs, the X-ray beam is able to cover the entire field of view of the scanner. This avoids the need for any horizontal motion; an entire 'line' can be captured in an instant. This allowed simplification of the motion to rotation of the X-ray source. 3rd and 4th generation designs differ in the arrangement of the detectors. In 3rd generation, the detector array is as wide as the beam, and must therefore rotate as the source rotates. In 4th generation, an entire ringof stationary detectors are used. The concept of electron beam CT, which some authors have called 5th generation. Some authors have described up to 7 generations of CT design. However, it is only generations one to four that are widely, and consistently, recognised. RTG tomography I. III. IV.
The third generation design suffers because it is highly sensitive to detector performance. Because of the fixed relationship of a detector to a specific part of the beam, any miscalibration or malfunction of an individual detector will appear as a ring in the final reconstructed image. As the detectors moved and were exposed to physical stress, loss of calibration and subsequent 'ring artifacts' were commonplace. The fourth generation, with its fixed detectors benefited not just from improved reliability of the detectors, but because the detectors could be automatically calibrated as the X-ray beam approached, and because the different reconstruction geometry meant that a malfunction would lead only to subtle loss of image contrast (fogging) rather than a visible ring. Solving the issue of detector stability has led 3rd generation designs to the dominant position in contemporary designs. 4th generation designs suffered very high cost (due to the large number of detectors) and had very high susceptibility to 'streak artifacts' (due to compton scattering). RTG tomography
Electron beam tomography (EBCT) was introduced in the early 1980s, by Andrew Castagnini, to improve the temporal resolution of CT scanners. Because the X-ray source has to rotate by over 180 degrees in order to capture an image the technique is inherently unable to capture dynamic events or movements that are quicker than the rotation time. Instead of rotating a conventional X-ray tube around the patient, the EBCT machine houses a huge vacuum tube in which an electron beam is electro-magnetically steered towards an array of tungsten X-ray anodes arranged circularly around the patient. Each anode is hit in turn by the electron beam and emits X-rays that are collimated and detected as in conventional CT. The lack of moving parts allows very quick scanning, with single slice acquisition in 50-100 ms, making the technique ideal for capturing images of the heart. EBCT has found particular use for assessment of coronary artery calcium,a means of predicting risk of coronary artery disease. Electron beam CT
The most advanced current commercial designs can perform image sweeps in as little as 0.025 seconds. The fastest mechanically swept X-Ray tube designs require about 0.33 seconds to perform an image sweep. For reference, current coronary artery angiography imaging is usually performed at 30 frames/second or 0.033 seconds/frame; EBT is far closer to this than mechanically swept CT machines. The very high cost of EBCT, and its poor flexibility (single-purpose cardiac scanners), has led to poor uptake; fewer than 150 of these scanners have been installed worldwide. EBCT's role in cardiac imaging is rapidly being supplanted by high-speed multi-detector CT, which can achieve near-equivalent temporal resolution with much faster z-axis coverage. EBCT A cutaway view of an EBCT22. e- gun, 23. e- beam, 24. focus coil, 27. beam bending coil, 28-31. target rings, 14. detector array, 11. scan tube. The e- beam is reflected by the target rings through the patient, to the detector on the opposite end of the scan tube.
In helical CT the X-ray source (and detectors) are attached to a freely rotating gantry. During a scan, the table moves the patient smoothly through the scanner; It was the development of two technologies that made helical CT practical The major advantage of helical scanning compared to the traditional shoot-and-step approach, is speed; a large volume can be covered in 20-60 seconds. This is advantageous for a number or reasons: often the patient can hold their breath for the entire study, reducing motion artifacts, it allows for more optimal use of intravenous contrast enhancement, and the study is quicker than the equivalent conventional CT permitting the use of higher resolution acquisitions in the same study time. The data obtained from spiral CT is often well-suited for 3D imaging because of the lack of motion mis-registration and the increased out of plane resolution. Helical CT has slightly lower z-axis resolution than step-and-shoot. Where z-resolution is critical but where it is undesirable to scan at a higher resolution setting (due to the higher radiation exposure required) e.g. brain imaging, step-and-shoot may still be the preferred method. Helical CT
High Resolution CT HRCT is performed using a conventional CT scanner. However, imaging parameters are chosen so as to maximize spatial resolution: • A narrow slice width is used (usually 1-2 mm) • A high spatial resolution image reconstruction algorithm is used • Field of view is minimized, so as to minimize the size of each pixel • Other scan factors (e.g. focal spot) may be optimized for resolution at the expense of scan speed
Multislice CT scanners are similar in concept to the helical or spiral CT but there are more than one detector ring. It began with two rings in mid nineties. Later, it was presented 4, 8, 16, 32, 40 and 64 detector rings, with increasing rotation speeds. Current models (2007) have up to 3 rotations per second, and isotropic resolution of 0.35mm voxels with z-axis scan speed of up to 18 cm/s. This resolution exceeds that of High Resolution CT techniques with single-slice scanners, yet it is practical to scan adjacent, or overlapping, slices - however, image noise and radiation exposure significantly limit the use of such resolutions. The major benefit of multi-slice CT is the increased speed of volume coverage. This allows large volumes to be scanned at the optimal time following intravenous contrast administration (angiography). The ability of multi-slice scanners to achieve isotropic resolution even on routine studies means that maximum image quality is not restricted to images in the axial plane - and studies can be freely viewed in any desired plane. Siemens introduced a CT with dual X-ray tube and dual array of 64 slice detectors. Dual sources increase the temporal resolution by reducing the rotation angle required to acquire a complete image, thus permitting cardiac studies without the use of heart rate lowering medication, as well as permitting imaging of the heart in systole. The use of two x-ray units makes possible the use of dual energy imaging, which allows an estimate of the average atomic number in a voxel, as well as the total attenutaion. This permits automatic differentiation of calcium (e.g. in bone, or diseased arteries) from iodine (in contrast medium) or titanium (in stents) - which might otherwise be impossible to differentiate. It may also improve the characterization of tissues allowing better tumor differentiation. Multislice CT
Mammography is the process of using low-dose X-rays (usually around 0.7 mSv) to examine the human breast. It is used to look for different types of tumors and cysts. In some countries routine (annual to five-yearly) mammography of older women is encouraged as a screening method to diagnose early breast cancer. Radiologists analyze the image for any abnormal growths. It is normal to use longer wavelength X-rays (typically Mo-K) than those used for radiography of bones. During the procedure, the breast is compressed by a dedicated mammography machine to even out the tissue, to increase image quality, and to hold the breast still (preventing motion blur). Both front and side images of the breast are taken. Deodorant, talcum powder or lotion may show up as Ca spots, and women are discouraged from applying these on the day of their investigation. Mammografie Normal (left) versus cancerous (right) mammography image
While the cost of mammography is relatively low, its sensitivity is not ideal, (45% to about 90% depending on factors such as the density of the breast). -> considerable ongoing research into the use of alternative technologies. Ultrasound is typically used for further evaluation of masses found on mammography or palpable masses not seen on mammograms. Ductograms are useful for evaluation of bloody nipple discharge when the mammogram is non-diagnostic. Contrast enhanced magnetic resonance imaging (MRI), has shown substantial progress. In this method, the breast is scanned in an MRI device before and after the intravascular injection of a contrast agent (Gadolinium DTPA). The pre-contrast images are "subtracted" from the post-contrast images, and any areas that have increased blood flow are seen as bright spots on a dark background. Since breast cancers generally have an increased blood supply, the contrast agent causes these lesions to "light up" on the images. The available literature suggests that the sensitivity of contrast-enhanced breast MRI is considerably higher than that of either radiographic mammography or ultrasound and is generally reported to be in excess of 95% (though not all reported studies have been as encouraging). Stereotactic breast biopsies are another common method for further evaluation of suspicious findings. Alternatives to mammography
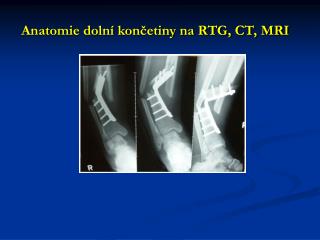
RTG tomography X-Ray CT slice showing heart and lungs
Příklady microCT 3D reconstruction of mCT data of trabecular bone around titanium implant and some indication for 2D slices 2D slice based on mCT data of bone with implant Histological slice of bone with implant 3D reconstruction through an oolitic limestone that clearly shows the porosity (white colour) of the oolites and shell material. Oolitic carbonate sample with about 20% bulk volume porosity.
Zobrazuje „látkovou přeměnu“, dynamickou distribuci látek Existují dvě základní metody SPECT (Single Photon Emission Computerized Tomography) realizována jako série planárních obrazů vyšetřovaného místa, snímaných pod různými úhly (0-360o) detektorem kamery obíhajícím kolem pacienta konstruují se tomografické obrazy příčných řezů vyšetřovaným objektem;série těchto obrazů transverzálních řezů pak vytváří celkový trojrozměrný obraz distribuce radioindikátoru (scintigrafie, gammagrafie - metoda značených atomů) PET - pozitronová emisní tomografie aplikován b+ radioindikátor, který v místech své distribuce emituje e+, které vzápětí anihilují s e- tomografického efektu se dosahuje koincidenční detekcí anihilačních fotonů, načež počítačovou rekonstrukcí velkého počtu takových koicidenčních paprsků se opět vytváří tomografický obraz příčného řezu vyšetřovanou oblastí Funkční (dynamická) tomografie
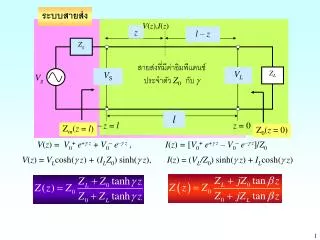
Schéma zářiče A( ) = A( ) . A( ) SPECT Platí pouze pro Dx << L Attenuační koef. pro celou úsečku (nezávisí na x,y) Dá se zjistit kalibračním měřením (zářič mimo tělo)
Pro Eg = 140 keV (Tc) je zeslabení na 1/e ve vodě (těle) asi po 5 cm Dx by mělo být určitě menší než 1 cm(pak lze zanedbat vliv zeslabení) SPECT Zpětná Radonova tranformace
Ze změřeného rozložení intenzit v jednotlivých směrech chceme rekonstruovat rozložení materiálu f(x,y) Jak na to? Radonova transformace (1917)(je to „podobné“ Fourierově transformaci) Z integrálů přes všechny úsečky (x cos + y sin - t = 0) chceme zpětně najít integrovanou funkci f(x,y) Vezměme si na pomoc Fourierovu transformaci y y0 t R(t,) x x0 t R(t,) t Matematika tomografie – Radonova transformace rovnice přímky je (x cos + y sin - t = 0)
Z integrálů přes všechny úsečky (x cos + y sin - t = 0) chceme zpětně najít integrovanou funkci f(x,y) přejděme do polárních souřadnic: Matematika tomografie – Radonova transformace R(t,) t Fourierova transformace: A zpětná „FT“ v pol. souřadnicích:
Produkce 99Mo 98Mo(n,g) štěpné produkty Tc samo o sobě štěpný produkt, ale díky době života nelze použít Závislost distribuce 99mTc na použitém radiofarmaku: -) Radioizotopy pro SPECT – 99mTc ( ) b- g, 140 keV 99Mo 99mTc 99Tc T1/2 = 66 h T1/2 = 6 h Velmi široké použití – je to nejvýznamnější lékařský izotop určený pro zobrazování Used for imaging and functional studies of the brain, myocardium, thyroid, lungs, liver, gallbladder,kidneys, skeleton, blood and tumors. močový systém kostra játra plíce
Generátor 99mTc • A 99mTc generator, or colloquially a Tc cow is a device used to extract the metastable isotope 99mTc from a source of decaying 99Mo. 99Mo has a half-life of 66 hours and can be easily transported over long distances to hospitals where its decay product 99mTc (with an inconvenient half-life of only 6 hours for transport) is extracted and used for a variety of nuclear medicine diagnostic procedures, where its low half-life is very useful. Mechanism • The half-life of 99Mo is much longer than that of 99mTc. 50% of equilibrium activity is reached within one daughter half-life. Hence, removing the daughter nuclide (elution process) from the generator ("milking" the cow) is reasonably done every 6 hours or, at most, twice daily in a 99Mo/99mTc generator. Most commercial 99Mo/99mTc generators use column chromatography, in which 99Mo is adsorbed onto acid alumina (Al2O3). Pulling normal saline solution through the column of immobilized 99Mo elutes the soluble 99mTc, resulting in a saline solution containing the 99mTc which is then added to an appropriate concentration to the organ-specific pharmaceutical to be used. The isotope can also be used without pharmaceutical tagging for specific procedures requiring only the 99mTc as the primary radiopharmaceutical. The useful life of a 99Mo/99mTc generator is about 3 parent half lives, or approximately one week. Hence, any clinical nuclear medicine units purchase at least one such generator per week or order several in a staggered fashion. • 99Mo can be obtained by the n activation (n,γ) of 98Mo in a high neutron flux reactor. The most used method requires a uranium target with high enriched uranium (up to 90% 235U) or low enriched uranium (less than 20% 235U). The target should be irradiated with neutrons to form 99Mo as a fission product.
Další používané radioizotopy Monitorování štítné žlázy b- příprava: 130Te(n,g)131Te 131I T1/2 = 25min EC EC 124Xe(p,2n)123Cs 123Xe 123I T1/2 = 6min T1/2 = 2.1h Radioizotopy pro SPECT – další izotopy b- g, 364 keV 131I 131Xe 131Xe T1/2 = 8d g, 159 keV EC 123I 123Te 123Te Progresivnější, méně škodí (kratší doba života, menší Eg) T1/2 = 13.2h příprava: g, 81 keV b- 133Xe 133Cs 133Cs štěpný produkt zobrazení dýchacího systému (kanálky,...) T1/2 = 5.2d g, 167 keV EC 201Tl 201Hg 201Hg progresivní trend zobrazení srdce T1/2 = 73h EC příprava: 203Tl(p,3n)201Pb 201Tl T1/2 = 9.3min
Příklady tvarů účinných průřezů Log škála • Příklad je pro (rychlým) neutronem vyvolané reakce, ale kvalitativní obrázek je podobný pro reakce vyvolané jinými částicemi Lineární škála
Příklady tvarů účinných průřezů • Příklad je pro (rychlým) neutronem vyvolané reakce, ale kvalitativní obrázek je podobný i pro reakce vyvolané jinými částicemi
Příklady tvarů účinných průřezů Integrated (with respect to the angle) spectra of neutrons from the 115In (α, xn) reactions • Spektrum n je dáno převážně hustotou koncových stavů • Pokud je jádro po emisi (prvního) neutronu stále nad neutronovou separační energií, jsou emitovány další n až do chvíle, kdy je příslušné jádro v excitovaném stavu pod neutronovou separační energií
SPECT Typical SPECT acquisition protocols