Download
1 / 41
410 likes | 553 Views
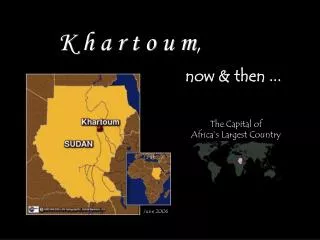
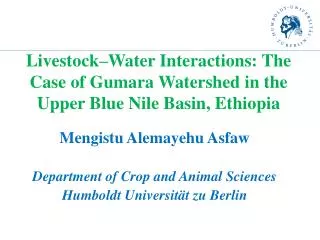
Livestock–Water Interactions: The Case of Gumara Watershed in the Upper Blue Nile Basin, Ethiopia. Mengistu Alemayehu Asfaw Department of Crop and Animal Sciences Humboldt Universität zu Berlin. Outline. I ntroduction Problem statement Objectives Materials and Methods

E N D
Livestock–Water Interactions: The Case of Gumara Watershed in the Upper Blue Nile Basin, Ethiopia Mengistu Alemayehu Asfaw Department of Crop and Animal Sciences Humboldt Universität zu Berlin
Outline • Introduction • Problem statement • Objectives • Materials and Methods • Description of study area • Study design and treatments • Statistical analysis • Results and Discussion • Livestock water productivity • Collective management on communal grazing lands • Determinants of good pasture condition • Conclusions and Recommendations
Mixed Farming Systems in the Highlands Integrated mixed crop-livestock farming
Multi-functions of livestock in mixed farming Nutritious products for home consumption Income source from livestock sales Asset accruing functions Renewable farm power source Manure • At National level • Livestock make 45% of the total agricultural GDP (Behnke and Metaferia, 2011)
Farm resource base of the mixed farming A need to increase resource productivity in a sustainable manner 1. Land tenure system • Land is under state ownership • Farmers have use right • Grazing is communal Due to increasing rural population • Land scarcity is critical • Pasture area is marginalized 2. Water scarcity • -Rain fed farming practice • - Highly seasonal • - Erratic rainfall • No water harvesting technology 3. Feed scarcity • Heavy reliance on crop residues • Over-exploitation of communal grazing lands • Critical during cropping • period The present study focused much on water productivity
Specific Objectives Refine the methodology for assessing LWP in the framework of Life Cycle Assessment Assess LWP in the mixed farming systems of the Ethiopian highlands Explore the impact of collective management on sustaining pasture ecosystem and land degradation Identify the determinant factors influencing good pasture condition
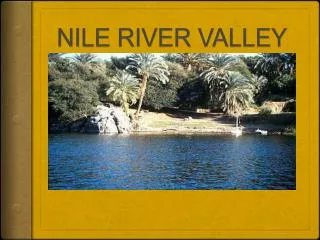
1.1 MATERIALS AND METHODS Study site - Gumara watershed was selected Reasons • Part of a big project in the Nile basin • Represents different mixed farming systems • Availability of hydrological information Major features • Topography varies from rolling rugged mountains to vast flat lands • Altitude ranges between 1780-3740 m above sea level • Rainfall distribution is uni-modal (1300-1500mm) in 3-4 months with low temperature
Study Design Three distinct scenarios of mixed farming systems • Rice/noug based farming complex (RNF) • Crop residues and aftermath grazing – major feed resource base • Livestock species- Cattle and equine
Study Design… ii)Tef/finger millet based farming complex (TMF) • Crop residues, pastureland and aftermath grazing – major feed resources • Livestock species- Cattle, equine, sheep, goats • Equines are used as pack animals
Study Design… iii) Barley/potato based farming complex (BPF) • Grazing land- major feed resource base • Livestock species- Sheep, cattle, equine • Use of horse and mule for ploughing cropland
Determination of LWP LCA is used to compile inventory in a defined system boundary (from cradle to farm gate –in the present study) The water foot print accounting was based on LCA frame of the herd's productive life time (birth to end of productive life) • LWP was determined using the framework of Life cycle assessment (LCA) and water foot printing concept • Depleted water –water used in livestock and no longer available for reuse in the domain • water for • Feed production (pasture and crop residues) • Drinking water • hygiene and processing • Out puts (milk, meat) • Services (draught power) • Asset (stock capital) • Manure Valued in monetary terms
Data Collection In applying LWP to Gumera watershed • 62 farmers were monitored for about 1.5 years • Sample farmers were stratified based on their wealth status • Wealth status (Poor, Medium and Rich) • Stratification criteria • Land holding • Livestock holding • Annual grain harvest • Additional income
Statistical analysis Yijk=µ+Fi+Wj+(F*W)ij+Eijk where; Yijk=response variable such as LWP, water use; µ=the overall mean, Fi=ith farming system, Wj=jth wealth status of smallholder farmers, (F*W)ij=interaction between farming system and wealth status, Eijk= error term. Yij=µ+Si+Eij where; Yij=response variable such as LWP, water use; • µ=the overall mean, • Si = Livestock species Eij= error term. T-test analysis – for comparing early off-take (at 2 years of age) and late off-take (at 4 years of age)
1.2 RESULTS AND DISCUSSION Table 1. LWP and CWP under three different mixed farming systems. More water loss 20% additional water CWP-crop water productivity; LWP-livestock water productivity; USD- United States Dollars
1.2 RESULTS AND DISCUSSION Table 2. LWP across wealth status of smallholder farmers in Gumara watershed. CWP-crop water productivity; LWP-livestock water productivity; USD- United States Dollars
1.2 RESULTS AND DISCUSSION Table 3. LWP under two off-take managements. Reduced by >50% LWP- livestock water productivity; USD- United States Dollars; TLU- tropical livestock unit
1.2 RESULTS AND DISCUSSION Table 4. LWP for different livestock species LWP – Livestock water productivity; USD- United States Dollars
Study Design Table 6. Description of different types of grazing land management (GLM). • Three types of Grazing Land Management (GLM) under two slope gradients (<10%, 15-25%) • The GLMs are: • restricted communal GLM • private holding GLM • freely open communal GLM • Identified villagers are recognized as members to have use right • The grazing land management is governed by local by-laws • Only fixed number of animals are allowed for grazing • Kept by a farm household for making hay and afterward grazing • Open for livestock in the village
Data Collection • Vegetation attributes: • Hrebacious biomass yield • Ground cover • determined along a 50m transect line in three replications • Runoff and soil loss: • measured from 18 plots each with 4x2 m2 demarcated using galvanized iron sheet • Soil moisture and bulk density • - Samples taken from each plot
Data Collection Stocking density, stocking rate and carrying capacity • Dry matter yield per ha • Daily feed intake of animals -using average animal weight method (Pratt and Rasmussen, 2001) • Grazing duration • Livestock number • Area of grazing land • Stocking density - is the actual number of livestock grazing on specific area of the pasture for specified period of time • Stocking rate- is the number of livestock grazing on the entire of the pastureland for the entire grazing period • Carrying capacity - is the maximum number of livestock that can be supported by a unit of grazing land for the entire grazing period without harm in the long term
Statistical analysis Parametric and non-parametric analysis were run uing a 3x2 factorial design Yij=µ+Gi+Sj+(G*S)ij+Eijk where; Yij=response variable; µ=the overall mean, Gi=ith type of GLM, Sj=jth slope of grazing land, (G*S)ij=interaction between GLM and slope, Eijk= error term.
2. 2 RESULTS AND DISCUSSION 46% of the herbage biomass is removed 80% of the herbage biomass is removed
2. 2 RESULTS AND DISCUSSION Table 5. Vegetation attributes across different types of GLM HBY – aboveground herbaceous biomass yield; GCw- ground cover after end of wet season; SEM – standard error of mean
2. 2 RESULTS AND DISCUSSION Table 6. Runoff and soil loss as affected by different types of GLM Runoff and Soil Loss Restricted communal GLM Reduce surface runoff by more than 40% Curb the rate of soil erosion by more than 50% RO = cumulative surface runoff per year; SL= annual soil loss; SEM – standard error of mean
Table7. Bulk density and soil moisture 2. 2 RESULTS AND DISCUSSION
Determinant Factors to Good Pasture Condition of Restricted Communal Grazing Land
3.1 Study area and design A cross-sectional study was carried out in barley/potato based farming system 42 villages were randomly selected 140 smallholder farmers were selected using multistage sampling technique
3.1 Data collection Explanatory variables to pasture condition 7 variables were used to explain the dependent variable Area of communal grazing land Area of restricted grazing land Area of cropland at household level Oxen number in a village Livestock density in a village Pasture resting period Soil fertility
3.1 Data collection Proxy indicators to pasture condition (PROGRAZE manual, 1996) Herbage DM yield using a quadrat, Legume proportion, Digestibility (Tilley and Terry, 1963 ) Carrying capacity/stocking rate
3.2 Statistical analysis Binary dependent variable -logistic regression model For DMY – Ordinary Least Squares (OLS) method was used
3. 2 RESULTS AND DISCUSSION Table 8. Logit regression coefficients of variables affecting pasture condition * significant at 10% level; ** significant at 5% level; *** significant at 1% level
CONCLUSIONS AND RECOMMENDATIONS • CWP was higher than LWP • LWP varied across different farming systems and wealth status • Cattle had higher LWP due to more values of the multiple functionalities and better feed utilization efficiency • Early off-take management scenario increased LWP
CONCLUSIONS AND RECOMMENDATIONS • Livestock mortality – is one of the main causes to decrease LWP • Overstocking is the major problem that aggravates overgrazing and eventually reduces LWP • Management of communal grazing land can be improved using local institutions and policy supports
Conceptual framework of livestock–water interactions to assess LWP (Peden et al. 2007) Fig. 4. LWP conceptual frame work
Data Collection Determination of LWP
2. 2 RESULTS AND DISCUSSION Fig.1. Quadratic relationship between soil loss and runoff on each rainfall event.