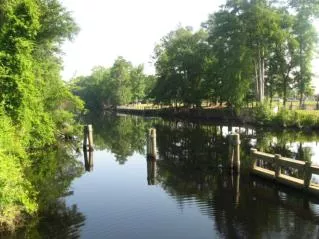
Water Quality
Water Quality. Intro by Erick Bjorkland Chesapeake Bay Case Study Brandon Powers Created Wetlands by Carol Ann Dulin Saltwater Case Study by Meghan Barron. Clean Water Act.


Water Quality
E N D
Presentation Transcript
Water Quality Intro by Erick Bjorkland Chesapeake Bay Case Study Brandon Powers Created Wetlands by Carol Ann Dulin Saltwater Case Study by Meghan Barron
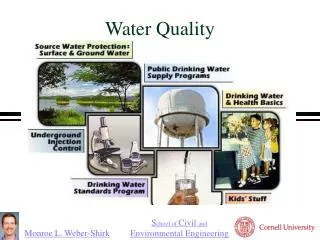
Clean Water Act In 1972 congress adopted the Clean Water Act, to restore and maintain the chemical, physical and biological integrity of the nation’s waters.
Water Quality Allows States,Tribes and Jurisdictions to set their own water quality standards, but requires that they met and include the “fishable and swimmable” goals of the act.
Water Quality • Provides for the protection and propagation of fish, shellfish and wildlife. • It provides for recreation in and on the water. • These are the “fishable and swimmable” goals of the Clean Water Act.
Water Quality Water quality has three elements. • Designed uses • Criteria developed to protect each use • Antidegradation policy
Water Quality Criteria • Numerical --- establish thresholds for the physical, chemical and biological attributes required to support a beneficial use. • Narrative --- describe, rather than quantify, conditions that must be maintained to support a designated use.
Antidegradation policies • Narrative statements intended to protect existing uses and prevent waterbodies from deteriorating even if their water quality is better than the fishable and swimmable goals of the Act.
Summary of Use Support for U.S. Waters • States reported that 49% of their assessed estuarine waters have good water quality that fully supports designated uses. • The remaining 51% has some form of pollution or habitat degradation.
States Reported That Pollutants: • Impact aquatic life in 11,391 square miles (about 52%) of estuarine waters. • Restrict fish consumption in 6,255 square miles ( about 48%) of estuarine waters. • Restrict shellfish harvesting in 5,288 square miles ( about 25%) of estuarine waters. • Violate swimming criteria in 3,245 square miles ( about 15%) of estuarine waters.
Pollutants • Pollutants come from point and nonpoint sources (NPS). • NPS include stormwater, diffuse agricultural runoff from pastures and row-crops, concentrated agricultural wastes from feedlots, runoff from building sites, forestry activities, drainage from mining activities. • NPS contribute > 65% of the total pollution load to U.S. inland surface waters (Olson).
Pollutants • Most often there is more than one pollutant impacting a single estuarine waterbody. • There are more square miles of estuarine waters polluted by metals than any other pollutant or stressor. Mercury is the primary metal pollutant. • The largest number of impaired streams and rivers is in the Appalachian region. This is caused by the leaching of heavy metals.
Pollutants in Estuaries • Pesticides pollute 5,985 square miles. • Oxygen depletion from organic wastes impact 5,324 square miles. • Pathogens impair4,764 square miles.
Pesticide pollution • The greatest potential for pesticide contamination is on the eastern seaboard. • Runoff is the major mode of transportation but 10-30% come from aerosol drift. • Still getting DDT from S. America via this mode. • Pesticides are even being detected in groundwater (atrazine, aldicarb and alachor)
Nitrogen and Phosphorous • Large amounts of N and P can cause to much vegetation growth and decay, leading to water chemistry changes and limited vegetation diversity. • Depending on the wetland, one or the other can act as a limiting agent for algal growth.
State Reported Sources • Municipal point sources (sewage treatment plants) are the most wide spread polluters (5,779 square miles). • Urban runoff impacts 5,045 square miles. • Industrial discharge pollute 4,116 square miles. • Atmospheric deposition impacts 3,692 square miles.
Benefits and Drawbacks • The Congaree Bottomland Hardwood Swamp removes the amount of pollutants annually that a 5 million $ treatment plant would. • Approximately 43% of the federally threatened and endangered species rely on these wetland. • >400 treatment plants discharge to natural wetlands in the Southeast alone. • Some wetlands receive all or most water inputs from sewage discharge.
State of the Nation Only 8% of the Nations total wetlands are surveyed.
Chesapeake Bay • Largest estuary in North America • Drains portions of six states • Virginia • Maryland • Delaware • Pennsylvania • New York • West Virginia • The District of Columbia
Top 4 Stressers on the Bay’s Systems • Toxic Chemicals • Air Pollution • Excess Nutrients • Human Influence
Main Cause of Chesapeake Bay’s Poor Water Quality • Excess Nutrients
Case Study • Benefits of water quality regulation in the Chesapeake Bay region from 1972-Present • Findings based on model changes in ambient water quality • Focuses on Nitrogen (N) and Phosphorus (P)
Effects of Excess Nutrients • Elevated levels of Nitrogen (N) and Phosphorus (P) create algal blooms • Depletes Oxygen (O) • Blocks Sunlight • Linked to outbreaks of pfiesteria (a toxin causing lesions on fish)
More Effects from Excess Nutrients • Fish Kills • Water unfit for recreational activities(boating, fishing, swimming) • Harmful to shellfish rendering them unfit for human consumption • Can cause human respiratory problems form toxins released into the air
Chesapeake Bay Program • Spurred by the Clean Water Act (CWA) • The First Chesapeake Bay Agreement was signed in 1983 • Maryland • Virginia • Pennsylavania • District of Columbia • Chesapeake Bay Commission ( a tri-state legislative body) • U. S. Environmental Protection Agency
Chesapeake Bay Agreement 1983 • Set up Chesapeake Bay Council • Implemented Water Quality Monitoring Program • Directly measured 19 water quality parameters • 49 stations in tributaries and mainstem bay • 2 times a month
Chesapeake Bay Agreement 1987 • Set a goal to reduce the nutrients Nitrogen (N) and Phosphorus (P) entering the Bay by 40% by the year 2000
Chesapeake Bay Agreement 1987 • Identified main sources of nutrients • Farmland • Urban Landscape • Wastewater Treatment Plants • Introduced Nutrient Reduction Practices
Nutrient Reduction Practices • Nutrient and animal waste management on agriculture land • Conservation tillage • Vegetated buffer strips at the edge of fields • Stream bank fencing • Ditching • Nutrient Management Planning
Nutrient Reduction Practices • Phosphate Detergent Bans • Wastewater Treatment Plants • Urban Best Management Practices • Erosion and Sediment Controls • Stormwater Management • Septic System Management
Nutrient Reduction Practices • Point Source Controls • Wastewater Treatment Plant Upgrades • Biological Nutrient Removal (BNR)
In 1992 the Chesapeake Bay Program Partners agreed to continue the 40% reduction goal beyond 2000 and began to attack nutrients at their source • Upstream and the Bay’s tributaries • Use long-term monitoring • Computer modeling
Chesapeake Bay Agreement 2000 • Bay Program Partners agree to work with the headwater states • Delaware • New York • West Virginia
Chesapeake Bay Agreement 2000 • Continue to improve on previous Nitrogen (N) and Phosphorus (P) goals • Implemented new water quality standards • Use Total Maximum Daily Load (TMDL)
Results • Between 1985 and 1997 • Annual Phosphorus (P) loads reduced by 8 million lbs • Annual Nitrogen (N) loads reduced by 32 million lbs
Results • Point Source Reduction between 1985 and 1997 • Annual Phosphorus (P) loads reduced by 16 million lbs • Annual Nitrogen (N) loads reduced by 5 million lbs
Results • Non-Point Source Reduction between 1985 and 1997 • Annual Phosphorus (P) loads reduced by 16 million lbs • Annual Nitrogen (N) loads reduced by 1 million lbs
Estimated Benefits • Total Benefits include • Recreation (fishing, boating, swimming) • Commercial (fishing) • Health • Non-use values • Property values • Regional economic values
Estimated Benefits • People in the Chesapeake Bay Watershed have received benefits that range from $360 million to $1.8 billion in total benefits • Beach users benefits range from $290 million to $1.5 billion • Trailered boating benefits range from $7 million to $84 million
Why wetlands for wastewater treatments? • Water saturated conditions lead to reduced gas exchange • Less gas exchange contributes to higher anaerobic activity, allowing abundant microbial growth • Combined, these attributes allow wetlands to transform organic materials into nutrients.
Improving Water Quality • Settling of particulate matter • Filtration and chemical precipitation through contact of water with substrate • Breakdown and transform pollutants by microorganisms
Wetland Systems • Free Water Surface Systems • Basins or channels • Natural or constructed barrier to prevent seepage • Shallow water depth, low flow viscosity, and presence of the plant stalks to regulate water flow
Subsurface Flow Systems • Trench or bed with impermeable layer • Built with slight inclination between inlet and outlet • Waste water flows horizontally through rhizosphere of wetland plants • Wastewater then treated by filtration, sorption, and precipitation processes in the soil and by microbial degradation • The effluent is then collected at the outlet channel and discharged
Things to keep in mind when designing a wetland for waste water treatment • Hydrology- most important!! • Climate and weather • High flows by rain and increased snow melt shorten the residence time of pollutants and efficiency of treatment decreases • Heavy rain after period of dryness has greatest impact on treatment efficiency • Freezing temps can reduce efficiency
Substrates • Soils • Ideal soil pH for treating wastewater: 6.5- 8.5 • Electrical conductivity • Affects the ability of plants and microbes to process the waste material. • Should be less than 4 for water treatment • Soil - Water control • Soils capacity to retain and remove containments • Sandy or gravely soils have high porosity values • High clay content helps retain phosphorus
Vascular Plants • Stabilize substrates and limit channelized flow • Slow water velocities, allowing suspended materials to settle • Take up Carbon, nutrients and trace elements and incorporate them into plant tissues • Transfer gases between atmosphere and sediments • Most wetlands are commonly constructed with emergent vegetation such as bulrushes, cattails and reeds