Scatter Plot
Scatter Plot. Example of data scattering between groups in experiment. Scatter Plot. Example of data scattering within groups in experiment. Gene Profiles. Gene profile on raw Signal data. Gene Profiles. Gene profile on logged Signal data. Gene Profiles.


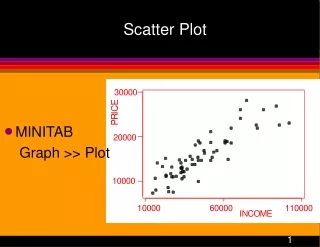
Scatter Plot
E N D
Presentation Transcript
Scatter Plot Example of data scattering between groups in experiment.
Scatter Plot Example of data scattering within groups in experiment.
Gene Profiles Gene profile on raw Signal data.
Gene Profiles Gene profile on logged Signal data.
Gene Profiles Gene profile on logged and normalised Signal data.
Hierarchical Clustering This visualization shows records in a dendrogram (a tree graph) based on the similarity between them. Clustering method: UPGMA (unweighted average)Similarity measure: CorrelationOrdering function: Average value
Gene Profiles (page 1) Gene profiles calculated from HC dendogram.
Gene Profiles Example of association between expression profiles and chromosomal location.