Download

1 / 9
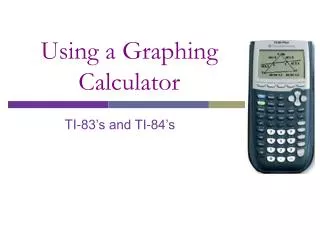
Using the Graphing Calculator to Create a Scatter Plot
100 likes | 280 Views
Using the Graphing Calculator to Create a Scatter Plot. Unit 8, Day 2 Mrs. King. Press the STAT button. Choose 1: Edit…. Enter the x values under L1 and the y values under L2. Press the 2 nd and Y= buttons. Turn the Plot “ON”. Press the ZOOM button Choose 9: ZoomStat. Now you try.
Download Presentation 
Using the Graphing Calculator to Create a Scatter Plot
An Image/Link below is provided (as is) to download presentation
Download Policy: Content on the Website is provided to you AS IS for your information and personal use and may not be sold / licensed / shared on other websites without getting consent from its author.
Content is provided to you AS IS for your information and personal use only.
Download presentation by click this link.
While downloading, if for some reason you are not able to download a presentation, the publisher may have deleted the file from their server.
During download, if you can't get a presentation, the file might be deleted by the publisher.
E N D
Presentation Transcript
Using the Graphing Calculator to Create a Scatter Plot Unit 8, Day 2 Mrs. King
Press the STAT button Choose 1: Edit…
Press the ZOOM button Choose 9: ZoomStat
Now you try • Construct a scatter plot for the data below:
Construct a scatter plot of the Length of Male Bear to the Weight of Male Bear in the table below.


More Related