Download
1 / 29
290 likes | 450 Views
Scatter plot of minimum pressure and maximum azimuthal wind for Atlantic and Eastern Pacific tropical cyclones (1989-2004 + Hurricane Isaac 2012 [red]). Figure adapted from: Knaff & Zehr, 2007, Weather Forecasting, 22 , 71-88. Global storm count: ~90 per year.

E N D
Scatter plot of minimum pressure and maximum azimuthal wind for Atlantic and Eastern Pacific tropical cyclones (1989-2004 + Hurricane Isaac 2012 [red]). Figure adapted from: Knaff & Zehr, 2007, Weather Forecasting, 22, 71-88.
Seasonal cycle of tropical cyclogenesis Northern Hemisphere solid Southern Hemisphere dashed
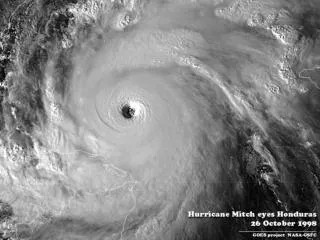
Hawkins, H. F., and D. T. Rubsam, 1968: “Hurricane Hilda, 1964. Part II: Structure and budgets of the hurricane on October 1, 1964. Monthly Weather Review, 96, 617-636.
Number of storms (1970-2011) in Northern Hemisphere (red) And Atlantic and North Pacific only (blue)
Atlantic Main Development Region SST (ASO mean) and power dissipation (whole season, whole basin) 1-3-4-3-1 filter applied to smooth interannual variability