Dot Plot to Scatter Plot
Dot Plot to Scatter Plot.


Dot Plot to Scatter Plot
E N D
Presentation Transcript
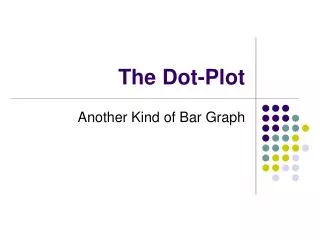
A dot plot is way to take the data on a single variable and give a summary picture of the data. You use the number line as the basis of the dot plot. As you go through each data value you put a dot just above the number line for the point. If another data point is a repeat of a previous value then you put another dot on top, and so on. I have a generic example on the bottom of this slide. You may note that when you have all the points listed that you get a similar feeling as you would in a histogram.
On the next slide I have some data about the size of a house in terms of square feet of space and the selling price of the house, measured in 1000’s of dollars. Note the data are in pairs. For example, the house with size 2,354 square feet had a sale price of 315 ($315,000). For now I want to focus on the sale price. Also on the next slide I created a dot plot for the sale price. It is a seemingly useless dot plot because no values are the same. So we have a bunch of dots just above the line. Programs like Microsoft Excel do not make these plots, so I put it together. I say that because you can see it is not perfect. But, Microsoft Excel does have some graphical tools that are similar.
100 200 300
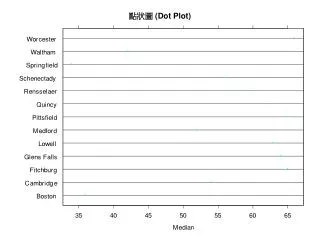
Here is something I could make in Excel with the click of about 3 buttons. The vertical axis is just the order of the data. Note the height of 1 has value 315. 315 is the first home price value. If you use your imagination you could have each dot fall to the number line and then you would have the dot plot. This graph here and the dot plot assist us in finding the minimum and maximum values fairly quickly.
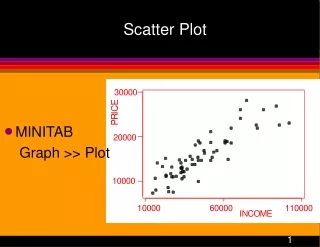
Next, I want to show you how you can go from a dot plot on one variable to a scatter plot on two variables. In all the graphs that follow the price of the house will be on the vertical axis. On the horizontal axis will be the size of the house in terms of the square feet. I add a data point at a time to the graph. Note the data are coming in the same order as the data is listed. If you again use your imagination maybe you can see each dot shoot out from the vertical axis that now lists the sale price of the house. Run through the slides fairly quickly.
Here we have all 12 pairs of data points plotted. I think you should go back to the data and look at each point and label the dots here as point 1, point 2, and so on.
While the dot plot shows on the 1 variable that not all the values are the same, the scatter plot shows that the reason the house prices are not all the same is because the houses have different sizes. In this example we see that that house size and house price are positively related. The dots in the scatter plot are going up the hill as you look at the dots from left to right.