
Uploaded by
rubaina
7 SLIDES
238 VIEWS
70LIKES
Relationships: Scatter Plot Matrix Analysis
DESCRIPTION
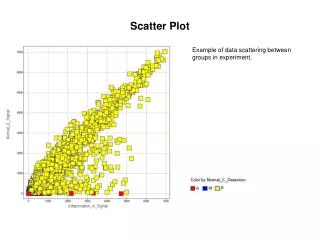
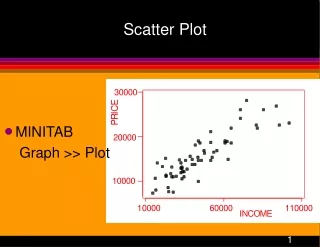
Complex data patterns can be effectively analyzed using a scatter plot matrix. This technique reveals correlations and trends among multiple variables, providing a comprehensive view of the data. By visualizing these relationships, users can gain valuable insights that facilitate data-driven decision-making. The scatter plot matrix serves as a powerful tool for identifying patterns that may not be immediately apparent, making it easier to understand interactions between different data points and variables.
Download Presentation 
Relationships: Scatter Plot Matrix Analysis
An Image/Link below is provided (as is) to download presentation
Download Policy: Content on the Website is provided to you AS IS for your information and personal use and may not be sold / licensed / shared on other websites without getting consent from its author.
Content is provided to you AS IS for your information and personal use only.
Download presentation by click this link.
While downloading, if for some reason you are not able to download a presentation, the publisher may have deleted the file from their server.
During download, if you can't get a presentation, the file might be deleted by the publisher.
E N D
Presentation Transcript








More Related

Audio
Live Player