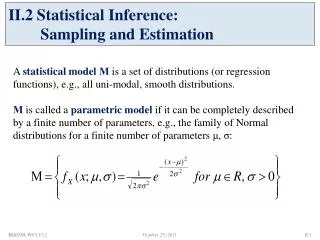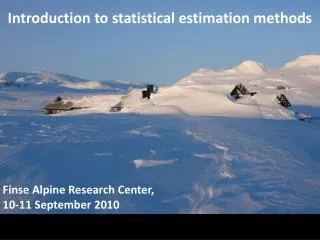
Statistical Estimation
Learn to estimate population parameters using point estimates, unbiased estimators, and interval estimates, including dealing with small sample sizes effectively.

Statistical Estimation
E N D
Presentation Transcript
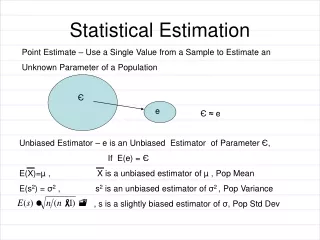
Statistical Estimation Point Estimate – Use a Single Value from a Sample to Estimate an Unknown Parameter of a Population Є e Є≈ e Unbiased Estimator – e is an Unbiased Estimator of Parameter Є, If E(e) = Є E(X)=µ , X is a unbiased estimator of µ , Pop Mean E(s2) = σ2 , s2 is an unbiased estimator of σ2 , Pop Variance , s is a slightly biased estimator of σ, Pop Std Dev
Interval Estimate – Bound the Parameter between a Upper and Lower Limit Lower Limit ≤ Parameter ≤ Upper Limit X - e ≤ µ ≤ X + e e – Error Bound – Maximum difference between X and µ which we expect to occur. α – Risk – Probability that the difference between X and µ will exceed e. We know from the Central Limit Theorem that the distribution for X will be Normal if we have a large enough sample size.
Sample Mean Distribution e e α/2 α/2 µ - e µ µ + e Standard Normal Distribution α/2 α/2 -Zα/2 Zα/2
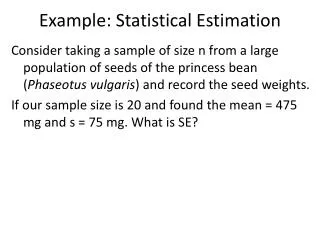
Interval Estimate - X – e ≤ µ ≤ X + e where and n ≥ 30 so σ≈ s Ex: n = 36, X = 20.6 yr and s = 3 yr with α = .05 Confidence Level – C = ( 1 – α )
Ex: n = 64, X = 42,000 miles, s = 10,000 miles with C = .90 & α = .10 Sample Size Calculation – Use sample size to control the error
Ex: Sample Size to Determine Ave Age for e = .5yr, σ = 3 yr, C = .95
Ex: Sample Size for Ave Cost at WSU for e = $250, σ = ?, C =.95
Standard Normal t (d.f. = 25) t (d.f. = 5) t (d.f. = 1) -3 -2 -1 0 1 2 3 Small Sample Size – n < 30 t- Distribution W.S. Gosset
t0.050 t0.100 t0.025 t0.010 t0.005 df 1 3.078 6.314 12.706 31.821 63.656 2 1.886 2.920 4.303 6.965 9.925 3 1.638 2.353 3.182 4.541 5.841 4 1.533 2.132 2.776 3.747 4.604 5 1.476 2.015 2.571 3.365 4.032 23 1.319 1.714 2.069 2.500 2.807 1.711 24 1.318 2.064 2.492 2.797 25 1.316 1.708 2.060 2.485 2.787 t 29 1.311 1.699 2.045 2.462 2.756 30 1.310 1.697 2.042 2.457 2.750 With df = 24 and a = 0.05, ta = 1.711. 40 1.303 1.684 2.021 2.423 2.704 60 1.296 1.671 2.000 2.390 2.660 120 1.289 1.658 1.980 2.358 2.617 1.282 1.645 1.960 2.327 2.576 Table of Critical Values of t
Confidence Interval – X - e ≤ µ ≤ X + e Ex: n =16, X = 20.6 yr, s = 3 yr, C = .95 Sample Size Calculation for Small Sample Problem?
Estimation of the Population Proportion n = sample size x = number with attribute = x/n Sample Proportion Estimator Unbiased? Standard Error for Estimator?
Ex: Percentage who plan to buy a new Car; n = 250, x = 80, C = 95 Ex: Percentage of Voters who will vote for Candidate; n = 400, x = 186, C = .90
Sample Size Calculation - Ex: Voter poll e = .01, C= .95, p = .50
Distribution of the Standard Error for Sample Proportion Ex: Sample Size to Estimate the Proportion Left-Handed
Finite Population Correction Ex: N = 5,000, e = .03, p = .30, C = .95