STATISTICAL INFERENCE PART I EXPONENTIAL FAMILY & POINT ESTIMATION
430 likes | 759 Views
STATISTICAL INFERENCE PART I EXPONENTIAL FAMILY & POINT ESTIMATION. EXPONENTIAL CLASS OF PDFS. X is a continuous (discrete) rv with pdf f(x; ), . If the pdf can be written in the following form.

STATISTICAL INFERENCE PART I EXPONENTIAL FAMILY & POINT ESTIMATION
E N D
Presentation Transcript
STATISTICAL INFERENCEPART IEXPONENTIAL FAMILY & POINT ESTIMATION
EXPONENTIAL CLASS OF PDFS • X is a continuous (discrete) rv with pdf f(x;), . If the pdf can be written in the following form then, the pdf is a member of exponential class of pdfs of the continuous (discrete) type. (Here, k is the number of parameters)
REGULAR CASE OF THE EXPONENTIAL CLASS OF PDFS • We have a regular case of the exponential class of pdfs of the continuous type if • Range of X does not depend on. • c() ≥ 0, w1(),…, wk() are real valued functions of for . • h(x) ≥ 0, t1(x),…, tk(x) are real valued functions of x. If the range of X depends on , then it is called irregular exponential class or range-dependent exponential class.
EXAMPLES X~Bin(n,p), where n is known. Is this pdf a member of exponential class of pdfs? Why? Binomial family is a member of exponential family of distributions.
EXAMPLES X~Cauchy(1,). Is this pdf a member of exponential class of pdfs? Why? Cauchy is not a member of exponential family.
( ) STATISTICAL INFERENCE • Determining certain unknown properties of a probability distribution on the basis of a sample (usually, a r.s.) obtained from that distribution Point Estimation: Interval Estimation: Hypothesis Testing:
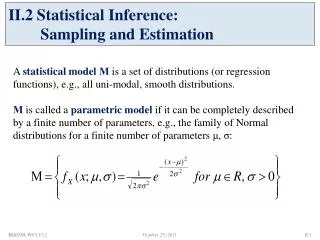
The family of pdfs { f(x; ), } STATISTICAL INFERENCE • Parameter Space ( or ): The set of all possible values of an unknown parameter, ; . • A pdf with unknown parameter: f(x; ), . • Estimation: Where in , is likely to be?
Estimator of an unknown parameter : A statistic used for estimating . STATISTICAL INFERENCE • Statistic: A function of rvs (usually a sample rvs in an estimation) which does not contain any unknown parameters. An observed value
POINT ESTIMATION • θ: a parameter of interest; unknown • Goal: Find good estimator(s) for θ or its function g(θ).
SOME METHODS OF POINT ESTIMATION Method of Moments Estimation, Maximum Likelihood Estimation, Least Squares Estimation
METHOD OF MOMENTS ESTIMATION (MME) • Let X1, X2,…,Xn be a r.s. from a population with pmf or pdf f(x;1, 2,…, k). The MMEs are found by equating the first k population moments to corresponding sample moments and solving the resulting system of equations. Population Moments Sample Moments
METHOD OF MOMENTS ESTIMATION (MME) so on… Continue this until there are enough equations to solve for the unknown parameters.
EXAMPLES • Let X~Exp(). • For a r.s of size n, find the MME of . • For the following sample (assuming it is from Exp()), find the estimate of : 11.37, 3, 0.15, 4.27, 2.56, 0.59.
EXAMPLES • Let X~N(μ,σ²). For a r.s of size n, find the MMEs of μ and σ². • For the following sample (assuming it is from N(μ,σ²)), find the estimates of μ and σ²: 4.93, 6.82, 3.12, 7.57, 3.04, 4.98, 4.62, 4.84, 2.95, 4.22
DRAWBACKS OF MMES • Although sometimes parameters are positive valued, MMEs can be negative. • If moments do not exist, we cannot find MMEs.
MAXIMUM LIKELIHOOD ESTIMATION (MLE) • Let X1, X2,…,Xn be a r.s. from a population with pmf or pdf f(x;1, 2,…, k), the likelihood function is defined by
MAXIMUM LIKELIHOOD ESTIMATION (MLE) • For each sample point (x1,…,xn), let be a parameter value at which L(1,…, k| x1,…,xn) attains its maximum as a function of (1,…, k), with (x1,…,xn) held fixed. A maximum likelihood estimator (MLE) of parameters (1,…, k) based on a sample (X1,…,Xn) is • The MLE is the parameter point for which the observed sample is most likely.
EXAMPLES • Let X~Bin(n,p), where both n and p are unknown. One observation on X is available, and it is known that n is either 2 or 3 and p=1/2 or 1/3. Our objective is to estimate the pair (n,p).
MAXIMUM LIKELIHOOD ESTIMATION (MLE) • It is usually convenient to work with the logarithm of the likelihood function. • Suppose that f(x;1, 2,…, k) is a positive, differentiable function of 1, 2,…, k. If a supremum exists, it must satisfy the likelihood equations • MLE occurring at boundary of cannot be obtained by differentiation. So, use inspection.
MLE • Moreover, you need to check that you are in fact maximizing the log-likelihood (or likelihood) by checking that the second derivative is negative.
EXAMPLES 1. X~Exp(), >0. For a r.s of size n, find the MLE of .
EXAMPLES 2. X~N(,2). For a r.s. of size n, find the MLEs of and 2.
EXAMPLES 3. X~Uniform(0,), >0. For a r.s of size n, find the MLE of .
Example:X~N(,2). For a r.s. of size n, the MLE of is . By the invariance property of MLE, the MLE of 2is INVARIANCE PROPERTY OF THE MLE • If is the MLE of , then for any function (), the MLE of () is .
ADVANTAGES OF MLE • Often yields good estimates, especially for large sample size. • Invariance property of MLEs • Asymptotic distribution of MLE is Normal. • Most widely used estimation technique. • Usually they are consistent estimators. [will define consistency later]
DISADVANTAGES OF MLE • Requires that the pdf or pmf is known except the value of parameters. • MLE may not exist or may not be unique. • MLE may not be obtained explicitly (numerical or search methods may be required). It may be sensitive to the choice of starting values when using numerical estimation. • MLEs can be heavily biased for small samples.
LEAST SQUARES ERROR • Minimize the square of error • Mostly used in regression • As an example consider simple linear model: • LSE says minimize
Problems 1. Let Xi (i=1,…,n) be a random sample from gamma distribution s.t.Xi~Gamma(2,θ). The p.d.f. of X1 is given by: • Is this a member of exponential class? b) Find the MLE of θ. c) Find the MME of θ.
Problems 2. Let be a random sample from inverse gamma distribution with the following probability density function. a) Does the distribution of belong to the exponential family of distributions? b) Find the kth moment, i.e. E(Xk), for any k=1,2,… c) Find MMEs of α and β.
Problems 3. Sometimes the regression function is known to be linear and go through the origin, i.e. Y=0 for X=0. For example, let Y be the volume of beer sales in the supermarkets, and X be the number of beer bootless stocked in these supermarkets. If X=0, then obviously Y=0. In such cases, the model can be given as in Equation (1). for i=1,2,…,n and (1) Here both β1 and σ² are unknown, and X’s are fixed values.
Problems a) Find the least squares estimator of β1 for the model given in Equation (1). b) Find the maximum likelihood estimator of β1 for the model given in Equation (1). c) Find the expected value of . d) Find the variance of .
Problems e) In an experiment involving 12 similar branch offices of a bank, new customers were offered gifts for opening accounts. The value of the gift was proportional to the minimum cash deposited in that branch. We would like to study whether such gifts were helpful in bringing new accounts. The following table provides the data.
Problems Calculate the estimate of β1 for this data. Write down the estimated regression equation given in Equation (1) for this data. Interpret your findings.