Chapter 7. Statistical Estimation and Sampling Distributions
Chapter 7. Statistical Estimation and Sampling Distributions. 7.1 Point Estimates 7.2 Properties of Point Estimates 7.3 Sampling Distributions 7.4 Constructing Parameter Estimates 7.5 Supplementary Problems. 7.1 Point Estimates 7.1.1 Parameters. Parameters


Chapter 7. Statistical Estimation and Sampling Distributions
E N D
Presentation Transcript
Chapter 7. Statistical Estimation and Sampling Distributions 7.1 Point Estimates 7.2 Properties of Point Estimates 7.3 Sampling Distributions 7.4 Constructing Parameter Estimates 7.5 Supplementary Problems
7.1 Point Estimates7.1.1 Parameters • Parameters • In statistical inference, the term parameter is used to denote a quantity , say, that is a property of an unknown probability distribution. • For example, the mean, variance, or a particular quantile of the probability distribution • Parameters are unknown, and one of the goals of statistical inference is to estimate them.
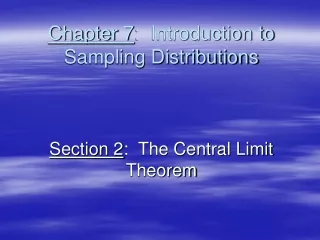
Figure 7.1 The relationship between a pointestimate and an unknown parameter θ
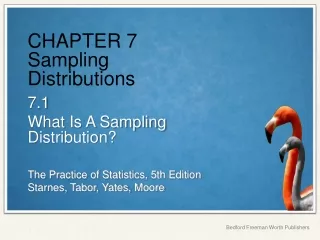
Figure 7.2 Estimation of the population meanby the sample mean
7.1.2 Statistics • Statistics • In statistical inference, the term statistics is used to denote a quantity that is a property of a sample. • Statistics are functions of a random sample. For example, the sample mean, sample variance, or a particular sample quantile. • Statistics are random variables whose observed values can be calculated from a set of observed data.
7.1.3 Estimation • Estimation • A procedure of “guessing” properties of the population from which data are collected. • A point estimate of an unknown parameter is a statistic that represents a “guess” at the value of . • Example 1 (Machine breakdowns) • How to estimate P(machine breakdown due to operator misuse) ? • Example 2 (Rolling mill scrap) • How to estimate the mean and variance of the probability distribution of % scrap ( ) ?
7.2 Properties of Point Estimates7.2.1. Unbiased Estimates (1/5) • Definitions - A point estimate for a parameter is said to be unbiased if - If a point estimate is not unbiased, then its bias is defined to be
7.2.1. Unbiased Estimates (2/5) • Point estimate of a success probability -
7.2.1. Unbiased Estimates(3/5) • Point estimate of a population mean -
7.2.1. Unbiased Estimates(4/5) • Point estimate of a population variance
7.2.2. Minimum Variance Estimates (1/4) • Which is the better of two unbiased point estimates?
7.2.2. Minimum Variance Estimates (3/4) • An unbiased point estimate whose variance is smaller than any other unbiased point estimate: minimum variance unbised estimate (MVUE) • Relative efficiency • Mean squared error (MSE) • How is it decomposed ? • Why is it useful ?
Example: two independent measurements Point estimates of the unknown C They are both unbiased estimates since The relative efficiency of to is Let us consider a new estimate Then, this estimate is unbiased since What is the optimal value of p that results in having the smallest possible mean square error (MSE)?
Let the variance of be given by Differentiating with respect to p yields that The value of p that minimizes Therefore, in this example, The variance of
The relative efficiency of to is In general, assuming that we have n independent and unbiased estimates having variance respectively for a parameter , we can set the unbiased estimator as The variance of this estimator is
Mean square error (MSE): Let us consider a point estimate Then, the mean square error is defined by Moreover, notice that
7.3.1 Sample Proportion (2/2) • Standard error of the sample mean
7.3.2 Sample Mean (1/3) • Distribution of Sample Mean
7.3.2 Sample Mean (2/3) • Standard error of the sample mean
7.3.3 Sample Variance (1/2) • Distribution of Sample Variance
Theorem: if is a sample from a normal population having mean and variance , then are independent random variables, with being normal with mean and variance and being chi-square with n-1 degrees of freedom. (proof) Let Then, or equivalently, Dividing this equation by we get Cf. Let X and Y be independent chi-square random variables with m and n degrees of freedom respectively. Then, Z=X+Y is a chi-square random variable with m+n degrees of freedom.
In the previous equation, Therefore,
7.3.3 Sample Variance (2/2) • t-statistics
7.4 Constructing Parameter Estimates7.4.1The Method of Moments (1/3) • Method of moments point estimate for One Parameter
7.4.1The Method of Moments (2/3) • Method of moments point estimates for Two Parameters
7.4.1The Method of Moments (3/3) • Examples - - • What if the distribution is exponential with the parameter ?
7.4.2Maximum Likelihood Estimates (1/4) • Maximum Likelihood Estimate for One Parameter
7.4.2Maximum Likelihood Estimates (2/4) • Example - - -
7.4.2Maximum Likelihood Estimates (3/4) • Maximum Likelihood Estimate for Two Parameters
7.4.2Maximum Likelihood Estimates (4/4) • Example
7.4.3 Examples (1/6) • Glass Sheet Flaws - The method of moment
7.4.3 Examples (2/6) • The maximum likelihood estimate:
7.4.3 Examples (3/6) • Example 26: Fish Tagging and Recapture
7.4.3 Examples (5/6) • Example 36: Bee Colonies
MLE for • For some distribution, the MLE may not be found by differentiation. You have to look at the curve of the likelihood function itself.