Download
1 / 47
470 likes | 639 Views
Topic 8: Energy, power, climate change 8.6 Global warming. 8.6.1 Describe some possible models of global warming. 8.6.2 State what is meant by the enhanced greenhouse effect. 340. 195. 75. 30. 165. 520. 70. 325. 350. 40. 100. GREENHOUSE ATMOSPHERE.

E N D
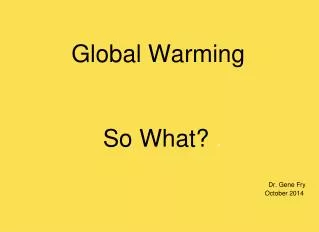
Topic 8: Energy, power, climate change8.6 Global warming 8.6.1 Describe some possible models of global warming. 8.6.2 State what is meant by the enhanced greenhouse effect.
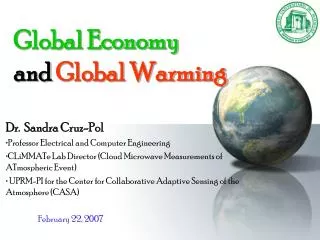
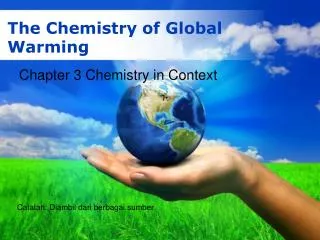
340 195 75 30 165 520 70 325 350 40 100 GREENHOUSE ATMOSPHERE 1st model constraint for temperature change Iin–Iout = 0 ∆T = 0 490 GROUND Topic 8: Energy, power, climate change8.6 Global warming Describe some possible models of global warming. The Sankey diagram presented at the end of Topic 8.5 The greenhouse effect showed that overall, the intensity entering each interface balanced precisely with the intensity leaving each interface. But if the input and output intensities are balanced the temperature remains constant. We show our first “model” for global warming here:
surface heat capacity surface heat capacity Cs = Q / (AT) Cs = 4108 JK-1m2 2nd model constraint for temperature change T = (Iin–Iout)∆t/Cs Topic 8: Energy, power, climate change8.6 Global warming Describe some possible models of global warming. Our second model describes the temperature change when Iin–Iout 0… Recall the concept of surface heat capacity. Recall that intensity I = P/A and P = Q/∆t. Then Q = CsAT (surface heat capacity) Qin – Qout= CsAT (net heat gain/loss) (Pin–Pout)∆t = CsAT (Q = P∆t) (Pin–Pout)∆t/A = CsT (Iin–Iout)∆t = CsT (I = P/A) Note: The 1st is just a special case of the 2nd.
540 340 195 75 30 500 165 70 335 360 20 110 GREENHOUSE ATMOSPHERE GROUND Topic 8: Energy, power, climate change8.6 Global warming Describe some possible models of global warming. • PRACTICE: Our equilibrium model has been adjusted as shown. Use the 2nd model constraint to find the change in temperature over one year. • SOLUTION: • At the interface of atmosphere and ground we have: • Iin = 165 + 335 = 500 • Iout = 360 + 20 + 110 = 490 • 1 year is ∆t = 1(365)(24)(3600 s) = 3.15107 s. • Thus T = (Iin–Iout)∆t/Cs T = (500-490)(3.15107)/(4108) = 0.79 K
Topic 8: Energy, power, climate change8.6 Global warming Describe some possible models of global warming. Real global warming models are extremely complex, simply because the earth and all of its energy-exchanging and storing systems are extremely complex. Supercomputers are used with some success. To gain some sort of insight into computer modeling, consider the following simple model: 5 kg of water is added to an aquarium once each second. 10% of the water is removed from the aquarium once each second. FYI The added water represents the incoming energy and the removed water is the outgoing energy.
Topic 8: Energy, power, climate change8.6 Global warming Describe some possible models of global warming. At first glance it might appear that the water level will never stop increasing. But consider the time when 5 kg is exactly 10% of the total water in the aquarium. From that time on, the water will be removed exactly as fast as it is added. Thus, at that time the “energy” represented by the water mass will have reached equilibrium. FYI The challenge is to find out how long it takes to reach equilibrium. Hand calculations are tedious but possible:
Topic 8: Energy, power, climate change8.6 Global warming Describe some possible models of global warming. PRACTICE: For the water model just proposed, complete the table: SOLUTION: The next cell would be 8.55 + 5 = 13.55. The next cell would be 0.10(13.55) = 1.355. The next cell would be 13.55 – 1.355 = 12.195. 13.55 1.355 12.195
Topic 8: Energy, power, climate change8.6 Global warming Describe some possible models of global warming. EXAMPLE: Create a spreadsheet to determine what the mass will be when the aquarium reaches equilibrium and how many seconds it will take. SOLUTION: Create a new spreadsheet with five columns as shown here: Highlight cell A3 and type in =A2+1 as shown. This will increment the A cells by 1 second.
Topic 8: Energy, power, climate change8.6 Global warming Describe some possible models of global warming. EXAMPLE: Create a spreadsheet to determine what the mass will be when the aquarium reaches equilibrium and how many seconds it will take. SOLUTION: Highlight cell B2 and enter 5. Highlight cell C3 and type in =B3+E2 as shown. This will add the new input of 5 to the previous total.
Topic 8: Energy, power, climate change8.6 Global warming Describe some possible models of global warming. EXAMPLE: Create a spreadsheet to determine what the mass will be when the aquarium reaches equilibrium and how many seconds it will take. SOLUTION: Highlight cell D3 and enter =0.1*C3. Highlight cell E3 and enter =C3-D3.
Topic 8: Energy, power, climate change8.6 Global warming Describe some possible models of global warming. EXAMPLE: Create a spreadsheet to determine what the mass will be when the aquarium reaches equilibrium and how many seconds it will take. SOLUTION: Highlight cells A3 through D3 all the way down to about row 100. Then select EditFillDown (or Ctrl+D) to copy down all of the formulas to each cell for all 100 rows.
Topic 8: Energy, power, climate change8.6 Global warming Describe some possible models of global warming. EXAMPLE: Create a spreadsheet to determine what the mass will be when the aquarium reaches equilibrium and how many seconds it will take. SOLUTION: Finally, make a graph or read the spreadsheet: The graph shows that the mass of water will be 45 kg at equilibrium. This will occur after about 45 seconds. equilibrium
60 N 60 N 30 N 30 N 0 0 30 S 30 S 60 S 60 S 0 90E 180 90W Topic 8: Energy, power, climate change8.6 Global warming Describe some possible models of global warming. EXAMPLE: Compare the following two images showing the world weather for July 1, 1998: Actual satellite view Hadley Centre's computer simulation Note the minor differences
Topic 8: Energy, power, climate change8.6 Global warming State what is meant by the enhanced greenhouse effect. Global warming (and cooling) are both natural processes and fluctuate in a periodic manner. The four causes of global warming and cooling are: -The sun’s varying power output. -The Milankovitch cycles. -Greenhouse gas fluctuation. -Radioactivity. We will discuss each in turn on the following slides. The enhanced greenhouse effect is that portion of the greenhouse effect that is caused by humans.
Topic 8: Energy, power, climate change8.6 Global warming State what is meant by the enhanced greenhouse effect. The sun’s varying power output Because the sun is fluid rather than solid, different latitudes rotate at different rates in a process called differential rotation. Differential rotation causes an 11-year sunspot and solar flare variation (with changing power output) and magnetic pole reversal.
Topic 8: Energy, power, climate change8.6 Global warming State what is meant by the enhanced greenhouse effect. The sun’s varying power output The first animation shows sunspots during a single rota- tion of the sun on its axis. The next animations show how far-reaching solar flares are.
Topic 8: Energy, power, climate change8.6 Global warming State what is meant by the enhanced greenhouse effect. The sun’s varying power output There is also a centuries-long variation in overall power output of the sun, with the 11-year sunspot activity superimposed: FYI The Maunder Minimum was a mini ice-age. Centuries 11 years Present 1645 - 1715 The Maunder Minimum
Topic 8: Energy, power, climate change8.6 Global warming State what is meant by the enhanced greenhouse effect. The Milankovitch cycles These extraterrestrial factors were enumerated in 1941 by Serbian Milutin Milankovitch in his great work on ice ages. Factor 1: The elliptical cycle. -In a 100,000-year long cycle the earth's elliptical orbit changes its shape. -Currently, our orbit is nearly circular: The fluctuation in the solar radiation reaching us between January and July is only 6%. -When the orbit is at its most eccentric fluctuation can be as great as 30%.
22.5° 24.4° 21.8° Topic 8: Energy, power, climate change8.6 Global warming State what is meant by the enhanced greenhouse effect. The Milankovitch cycles These extraterrestrial factors were enumerated in 1941 by Serbian Milutin Milankovitch in his great work on ice ages. Factor 2: The tilt cycle. -In a 42,000-year long cycle the earth's rotational axis tilt varies between 21.8° and 24.4° (Currently, our tilt is 22.5°). -Tilt determines at which latitude most of the solar radiation falls.
Topic 8: Energy, power, climate change8.6 Global warming State what is meant by the enhanced greenhouse effect. The Milankovitch cycles These extraterrestrial factors were enumerated in 1941 by Serbian Milutin Milankovitch in his great work on ice ages. Factor 3: The wobble cycle. -In a 22,000-year long cycle the earth's rotational axis wobbles like a precessing top. -Currently, our north pole is aimed at Polaris, the Pole Star. -The axis can also point to Vega, and all points in between. Polaris Vega FYI When Vega marks true north the in- tensity of the seasons is much more extreme.
Topic 8: Energy, power, climate change8.6 Global warming State what is meant by the enhanced greenhouse effect. The Milankovitch cycles These extraterrestrial factors were enumerated in 1941 by Serbian Milutin Milankovitch in his great work on ice ages. Milankovitch’s work was not recognized until the late 1960s because it was in Serbian. In the 60s just such cycles were being discovered in sediment and ice-core studies. FYI At their most extreme, Milankovitch cycles bring an annual variation of the sun’s power of less then 1/10th of 1 percent. Yet this seemingly trivial variation causes Earth’s average temperature to rise or fall by 9°F!
Topic 8: Energy, power, climate change8.6 Global warming State what is meant by the enhanced greenhouse effect. Greenhouse gas fluctuation Both solar fluctuation and the Milankovitch cycles are extraterrestrial sources of global warming and cooling. One of the two terrestrial causes are the greenhouse gases. (The other is the earth’s interior heat.) Carbon dioxide, water vapor, methane, and nitrous oxide are all greenhouse gases which are capable of absorbing a portion of the IR energy emitted by the earth. FYI The enhanced greenhouse effect is caused by humans increasing their levels.
Topic 8: Energy, power, climate change8.6 Global warming State what is meant by the enhanced greenhouse effect. Radioactivity The interior of the earth itself is quite hot. The two sources of internal heat are -radioactive minerals within the mantle, which provides about 80-90% of Earth’s internal heat, -and accretion remnants, which is the energy left over from the forming of the earth through accretion. FYI These effects are quite minimal in the global warming scenario. Recall that volcanoes only add about 1% of the CO2 added yearly to the atmosphere as compared to human-added CO2.
Topic 8: Energy, power, climate change8.6 Global warming State what is meant by the enhanced greenhouse effect. The controversies Data may or may not convince one of the first controversy but probably Earth is warming. Given that humans produce greenhouse gases we can probably rule out the second controversy. Extremely complex computer simulations are integral to deciding the third controversy, which helps to explain its divisiveness. Global warming is really happening. Global warming is not really happening. Global warming is enhanced by man. Global warming is not enhanced by man. Enhanced greenhouse effect is a significant portion of the overall global warming. Enhanced greenhouse effect is not a signifi- cant portion of the overall global warming.
Topic 8: Energy, power, climate change8.6 Global warming 8.6.3 Identify the increased combustion of fossil fuels as the likely major cause of the enhanced greenhouse effect. 8.6.4 Describe evidence that links global warming to increased levels of greenhouse gases. 8.6.5 Outline some of the mechanisms that may increase the rate of global warming. -Increased Greenhouse gases caused by burning fossil fuels. -Decreased albedo caused by melting ice caps.
Topic 8: Energy, power, climate change8.6 Global warming Identify the increased combustion of fossil fuels as the likely major cause of the enhanced greenhouse effect. Note that deforestation accounts for only 8.1 / (29.2 + 8.1 + 8.4 + 3.7 + 0.5) = 16% of human-caused greenhouse gas production. Thus fossil fuels produce 84% of our greenhouse emissions. Breakdown of world greenhouse gas emissions in 2004 by gas (except ozone), in billion tonnes CO2 equivalent. From IPCC, 2007.
Topic 8: Energy, power, climate change8.6 Global warming Describe evidence that links global warming to increased levels of greenhouse gases. The graph shows the seasonal variation of atmospheric CO2. Note the seasonal fluctuations showing an increase in cooling months and a decrease in warming months. Note the overall increase in CO2 levels. warming months cooling months
Topic 8: Energy, power, climate change8.6 Global warming Describe evidence that links global warming to increased levels of greenhouse gases. PRACTICE: Explain why the atmospheric concentration of CO2 increases in winter and decreases in summer. SOLUTION: It’s is all about living carbon sinks that store CO2 in the summer and release it in the winter: Namely- plants and their respiration and decomposition.
Topic 8: Energy, power, climate change8.6 Global warming Describe evidence that links global warming to increased levels of greenhouse gases. The previous data shows a steady increase in atmospheric CO2. But how does this correlate to average temperature? And how do we determine the geological correlations? The answer is ice cores. From the concentration of the isotopes of hydrogen in the water we can determine the mean global temperature. From the trapped air we can determine the greenhouse constituents of the atmosphere. Ice core sections stored at the National Ice Core Laboratory in Colorado
Topic 8: Energy, power, climate change8.6 Global warming Analysis of the core has been completed to a depth of 3350 meters, representing about 440,000 years of climate history. Vostok ice core drilling site, Antarctica
Topic 8: Energy, power, climate change8.6 Global warming Describe evidence that links global warming to increased levels of greenhouse gases. The graph shows the results of the Vostok ice core analyses, representing CO2 levels and temperatures going back 425,000 years (before present). Note the very strong correlation between them. Which Milankovitch cycle seems to be driving this variation? 100000 y The elliptical variation.
Topic 8: Energy, power, climate change8.6 Global warming Describe evidence that links global warming to increased levels of greenhouse gases. The temperature and CO2 overlays show approximately that sometimes temperature change leads, and sometimes it follows change in CO2 levels: So which change causes the other to change?
Topic 8: Energy, power, climate change8.6 Global warming Describe evidence that links global warming to increased levels of greenhouse gases. A more detailed plot shows perhaps that CO2change leads temperature in change. But the overall percentages from the previous graph gives the lead slightly to temperature…
Topic 8: Energy, power, climate change8.6 Global warming Outline some of the mechanisms that may increase the rate of global warming. Obviously, increased need for energy leads to increased burning of fossil fuels (or biomass) which leads to more greenhouse gases, which would increase the rate of global warming. FYI This graph is compiled by the wishful thinkers located at http://www.via-azul.eu/
Topic 8: Energy, power, climate change8.6 Global warming Outline some of the mechanisms that may increase the rate of global warming. Another mechanism would be the decreased albedo caused by melting ice caps. Ice and snow have the highest albedo (0.6) of any terrestrial landscape. Less light would be reflected by snow and ice and more would be absorbed. Anecdotal evidence - Observations of changes in the environment in our lifetimes...
Topic 8: Energy, power, climate change8.6 Global warming Outline some of the mechanisms that may increase the rate of global warming. Deforestation is also a factor. Forests are active carbon sinks, removing CO2 from the atmosphere during respiration.
Topic 8: Energy, power, climate change8.6 Global warming 8.6.6 Define coefficient of volume expansion. 8.6.7 State that one possible effect of the enhanced greenhouse effect is a rise in mean sea level. 8.6.8 Outline possible reasons for a predicted rise in mean sea level.
expansion due to ∆T V = V0T Topic 8: Energy, power, climate change8.6 Global warming Define coefficient of volume expansion. Substances E X P A N D as they are warmed up according to the equation where is the coefficient of volume expansion. The formula shows that the change in volume of an object is proportional to its original volume times the temperature change. This formula works for both solids and liquids.
Topic 8: Energy, power, climate change8.6 Global warming State that one possible effect of the enhanced greenhouse effect is a rise in mean sea level. As the ocean warms up its seawater expands, taking up more volume. Thus global warming will cause the sea level to rise. Furthermore as Earth warms up, landlocked glaciers will melt, adding to the rise in sea level. FYI During ice ages when the land ice is enhanced by continental-sized glaciers, the sea level can decrease by 100 meters! The ice melt we are most concerned most with, in terms of present-day sea level rise, is glaciers and the Antarctic ice shield.
Topic 8: Energy, power, climate change8.6 Global warming 8.6.9 Identify climate change as an outcome of the enhanced greenhouse effect. 8.6.10 Solve problems related to the enhanced greenhouse effect. Problems could involve volume expansion, specific heat capacity and latent heat. Done!
expansion due to ∆T V = V0T Topic 8: Energy, power, climate change8.6 Global warming Solve problems related to the enhanced greenhouse effect. From the formula we can solve for : = V / V0T = (V2-V1)/V1(T2-T1).
Topic 8: Energy, power, climate change8.6 Global warming Solve problems related to the enhanced greenhouse effect. PRACTICE: The land ice sheet consists of landlocked glaciers (in mountains) and the Antarctic ice shield. The north polar ice sheet is over water (floating). Explain why melting the north polar ice shield does not change the sea level, whereas melting the Antarctic ice shield does. SOLUTION: A floating object displaces water equal to its weight. Thus when floating ice becomes water, it just fills in the space in the ocean it already took up and doesn’t change its depth.
Topic 8: Energy, power, climate change8.6 Global warming Solve problems related to the enhanced greenhouse effect.
Topic 8: Energy, power, climate change8.6 Global warming 8.6.11 Identify some possible solutions to reduce the enhanced greenhouse effect. -Increase power production efficiency. -Replace coal and oil with natural gas. -Use combined heating and power systems (CHP). -Use renewable energy and nuclear power. -Use CO2 capture and storage. -Use hybrid vehicles.
Topic 8: Energy, power, climate change8.6 Global warming 8.6.12 Discuss international efforts to reduce the enhanced greenhouse effect. -Intergovernmental panel on climate change (IPCC), -Kyoto Protocol, -Asia-Pacific Partnership on Clean Development and Climate (APPCDC).