Implementing Benchmarks and Performance Indicators for evaluating University International Collaboration
250 likes | 370 Views
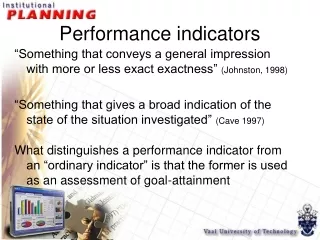
This document outlines a strategic action plan for implementing benchmarks and performance indicators (B&PI) to evaluate international collaboration within universities. It emphasizes the need for quality assurance systems to enhance the attractiveness of the European higher education system and improve institutional accountability. Key elements include student and staff mobility, participation in the Bologna Process, and effective engagement in externally funded projects. The findings highlight current gaps in existing quality assurance practices, outlining a pathway for building a robust framework that fosters effective international collaboration across institutions.

Implementing Benchmarks and Performance Indicators for evaluating University International Collaboration
E N D
Presentation Transcript
Implementing Benchmarks and Performance Indicators for evaluating University International Collaboration Funded by the Accompanying Measures Programme Contract No: 2004-4606/001-001 S02 81 AWC Project Acronym: BEPIQUA
Need for an Action Plan? • Lisbon Strategy • European Research Area: ERA • European Higher Education Area: EHEA • Bologna Process Quality Assurance key driver of Bologna and Lisbon strategy Quality of the Educational System key underpinning factor of goals for a knowledge-based society
Global Attractiveness of European HE system • Need to enhance attractiveness of European educational (teaching and research) system • Internationalisation IS NOT ONLY Mobility • Need to ascertain means of “institutional comparability” in performance International Collaboration a KEY driver
Establish a QA System QA system for international collaboration What does international collaboration entail? From the BEPIQUA Survey: • Mobility (students and staff) • Bologna Process (ECTS/DS, EQF, Joint Degrees etc) • Externally funded programmes (research and others) • Effective participation in ERA & EHEA • National & Institutional IR activities
Present situation of use of QA Survey ascertained: • Majority of Universities sampled (90%+) had no established QA system • Majority of those who had, IR was not included • However, “Quality Consciousness” existed • A lot of the basic data and infrastructure exists • “Quality Culture” exists
Is the time right for a QA System? ALL the prerequisites for establishing a QA system exist: • International environment • Institutional will (political and human) • Availability of basic factors (IT infrastructure, human dexterities, primary data)
Common methodology and approach (1) Need to establish Benchmarks (B) and Performance Indicators (PI´s) Benchmark: level of achievement set for a particular activity Performance Indicator: sets Rate/Quality of work needed to achieve benchmark target
Examples of B & PI´s Student mobility Benchmark (B): To achieve 250 outgoing students by 2010 Performance Indicator (PI): To achieve an increase of 30 outgoing students /year B=250 students (target) PI=30 studs/year 100 students 2005 2010
Common methodology and approach (2) Need to establish a set of B&PI´s in order to cover all the areas of International Collaboration: • Mobility: incoming-outgoing: students/staff • Bologna process: 3-cycle system, ECTS/DS, recognition procedures etc • Externally funded projects: Total project number & value, incoming funds, co-funding, geographic coverage of partners, No. of projects coordinated, No. of patents, products, jobs etc
Common methodology and approach (3) • Contribution to national goals: No. of bilateral projects, agreements, partners, spin off companies, countries etc • Contribution to institutional goals: No of transnational projects, partners, developing & third country projects, geographic coverage etc
EXAMPLE: EXTERNALLY FUNDED PROJECTS (2) Fictitious Example Benchmarks: B:5.1: Total Value of External Project Funding (A) = €3,000,000 B:5.2: Incoming Project Funding (B)= €465,000 B:5.3 Total Institutional cash co-funding (C) = €10,000 B:5.4: Total No. of partners = 25 B:5.5 Geographic Coverage = No. of Countries/Regions B:5.6: No. of Projects Coordinated = 5 B:5.7: Total No. of projects = 25 B:5.8: Incoming Funds (B)/ Total Funds (A)= 15.5% B:5.9: No. of Projects Coordinated/Total No. of Projects= 20% B:5.10: Co-funding(D)/Incoming Funds (A)= 4.7% B:5.11: External Incoming Funds (B)/University Budget= €3,000,000/68, 000,000 = 4.4% [This could also be expressed as a percentage of the Institutional Research + International Relations Budget = €3,000,000/3,400,000= 88.2%]
EXAMPLE: EXTERNALLY FUNDED PROJECTS (3) “PRIMARY DATA”: Figure 1: Typical data base input for Externally Funded Programmes External Funding Agency: [EU] Type of Programme: [FP7] Title of Project Proposal: Project Acronym: Mode of Participation: [Coordinator]; [Partner] Name(s) of Responsible Scientist(s): Participating Department: Project Duration: Start-up Date: Closure Date: Submission Date: Total Project Budget: Institution´s Project Budget Allocation: Institution´s Total Contribution: Cash Co-funding: Contribution in-kind: Project Type: [Research]; [Non-Research] Scientific Area: External Partner(s) Details: Partner Countries: Internal Partner(s): Project Staff: [Research Assistants]; [Administrators]; [Secretarial staff]
Examples of B & PI´s (1) • Mobility: Set target Institutional for 2010 Number of students [out/in & teachers] Annual Rate of increase [decrease] Previous 5-year trend: No. of active partners [bilateral agreements] Geographic distribution of partners % of disciplines covered to available total
Examples of B & PI´s (2) • Bologna Process Annual Rate of implementation of ECTS/DS Target date for achieving ECTS/DS Labels Rate of implementing 3-cycle system Degree of Compliance with National/ European Qualifications Frameworks % Recognition of Joint Degrees
Examples of B & PI´s (3) • Externally Funded Projects Total Value of Projects Total incoming Project funds Geographic coverage of partners No. of partners % of projects coordinated Total No. of projects % of incoming funds/total project funding
Examples of B & PI´s (4) % of co-funding/incoming funds Previous 5-year trend in: No. of projects Incoming funds % incoming/total value of projects % co-funding/incoming funds Success Rate of projects funded % of projects coordinated % of external funding/total Institutional budget
Examples of B & PI´s (5) Percentage of Annual Increase [decrease]: % change in partners % change in geographic distribution % change projects coordinated % change in No. of projects funded/ funding % change in annual institutional funding % change in co-funding % change success rate of projects funded
Examples of B & PI´s (6) • Effective participation in ERA/EHEA No. of research posted created No. of other posts created No. of incoming EU researchers No. of incoming third country researchers No. of outgoing researchers No. of returning researchers No. of patents No. of commercial products No. of spin off companies
Examples of B & PI´s (7) No. of Basic Research projects No. European Infrastructure projects No. of Centres of Excellence No. of publications in international scientific journals No. of citations in international scientific journals Comparable PI´s would be generated
Examples of B & PI´s (8) • Contribution to National Goals No. of active Bilateral agreements No. of partners/ countries/geographic coverage Satisfaction of other national goals, ie No. of Incubators/Science Parks No. of private/public partnerships
EXAMPLES: POLICY PREDICTION (1) Example 1: Linearly increasing past 5 year trend Outgoing Predicted Students Target * * * * * 2001 2005 2010 Predict new Benchmark but also assess required CAPACITY in Human Resources and Technical Infrastructure
EXAMPLES: POLICY PREDICTION (2) External Predicted Project Amount Co-funding (2010) Euro Rate of annual * * increase required * * from own budget * 2001 2005 2010 Prediction of required co-funding
EXAMPLES: POLICY PREDICTION (3) Outgoing Teachers * * * * Need to “bottom-out” falling trend * 2001 2005 2010 Need to Re-engineer Policy and Administrative System
ACTION PLAN FOR REALISING A QA SYSTEM BASED ON B&PI´s • Political decision to establish a QA system • Set institutional goals and objectives in International Collaboration • Identify B&PI´s that satisfy HEI goals & objectives (Use “generic” B&PI´s as basis) • Develop software to produce automatically B&PI´s from “primary data” • Promote the required “Quality Culture”, which is necessary to “drive” the QA system • “Centralise” data so as to enable the production of the “Institutional Profile” as regards International Collaboration • Establish the required feedback mechanisms for reformulation or “tuning”of the international collaboration policy, based on the results of the B&PI´s