Download
1 / 19
190 likes | 326 Views
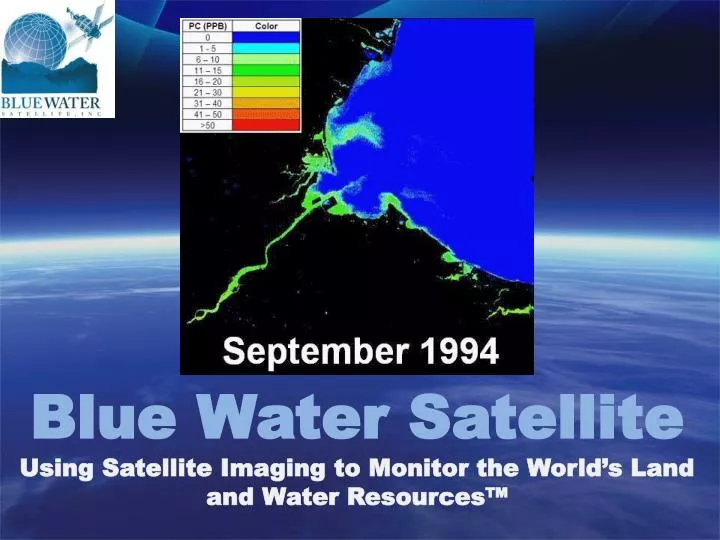
Blue Water Satellite Using Satellite Imaging to Monitor the World’s Land and Water Resources™ . …to see where the problems are . Blue Water Satellite. Using Landsat…. You CAN’T tell this……. From this…. To make intelligent decisions need more data. BWS=5 samples/acre. Science. Light.

E N D
Blue Water Satellite Using Satellite Imaging to Monitor the World’s Land and Water Resources™
…to see where the problems are. Blue Water Satellite Using Landsat…
You CAN’T tell this…… From this…. To make intelligent decisions need more data. BWS=5 samples/acre
Science Light Prism 1.7 1.3 .9 Band 1 Band 2 Band 7 Ratios of reflected light intensity is “fingerprint” for the constituent
Technology • Uses Landsat and commercial satellites • Technology Bowling Green State University (BGSU). • $1 million in funding from NASA and NOAA over 2 ½ years for validation. • Exclusive license (3) issued patents and (8) pending patents • Peer reviewed science • Ability to go back in time to 1984 • 5 samples/acre • Worldwide China, Australia, Canada, US, Etc.
Case Study #2 Identifying Point Source Problems on Land The image below details Total Phosphorus on Land (TPL) in an agricultural area
Case Study #3Reducing Treatment Cost • Planned Treatment : • Apply Alum in entire lake $2,200,000 • BWSI Solution: • Target Alum to affected areas $1,300,000 • Cost of Satellite Images $ 40,000 • Total $1,340,000 • Customer Savings: $860,000! “You really can’t get this information in a cost-effective manner any other way. It’s a real bargain if you’re trying to do comprehensive sampling of the lake. It’s the only way to get the information we want in a cost effective manner because it’s lake wide and it’s a big lake. – Frank Pickett PPL Montana
Case study #4 Risk MitigationThe Blue Water Satellite Viewer (BWS Viewer™) enables clients to: Compare water bodies and constituentsQuickly evaluate current and historic trends
Case Study #5 Temperature Plumes The image below details temperature in water (Deg C)
Case Study #6 Aid in Determining Problem Sources Ohio River 2008 Cincinnati Ohio River Ohio River Licking River Cyanobacteria Landsat processed Image Landsat Natural Color Image
Case Study #6 Aid in Determining Problem Sources Licking River 2008 Licking River Heavy Green color Discharge Start of Bloom Different Green Color Landsat Natural Color Image Landsat Processed image
Case Study # 7 Total Phosphorus Land Finding a leaky septic system in abandoned summer camp 1998 Aerial Photograph Total Phosphorus Land High Phosphorus Land Lake Attitash Abandoned Summer Camp with leaky Septic system
BWS Range and Accuracy A Above 60 ppb will measure 60 ppb
Pipeline Monitoring Blue Water Satellite Deliverables •Geo TIFF file for each image (for ArcGIS) •Processed images (pdf, tiff, or jpeg) •Custom report (sample page as shown) •Accuracy data •BWS Viewer ™ (optional)
Blue Water Satellite No one sees it like Blue Water Satellite. No one. For additional information 855-885-5648