Download
1 / 10
100 likes | 199 Views
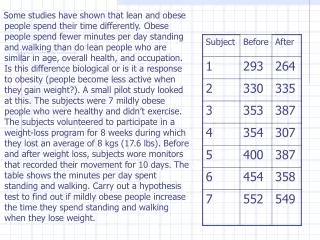
Some studies have shown that lean and obese individuals spend their time differently. This study investigates if weight loss in mildly obese individuals leads to increased time spent standing and walking. Statistical methods, including hypothesis testing and confidence intervals, are utilized to analyze the data.

E N D
Some studies have shown that lean and obese people spend their time differently. Obese people spend fewer minutes per day standing and walking than do lean people who are similar in age, overall health, and occupation. Is this difference biological or is it a response to obesity (people become less active when they gain weight?). A small pilot study looked at this. The subjects were 7 mildly obese people who were healthy and didn’t exercise. The subjects volunteered to participate in a weight-loss program for 8 weeks during which they lost an average of 8 kgs (17.6 lbs). Before and after weight loss, subjects wore monitors that recorded their movement for 10 days. The table shows the minutes per day spent standing and walking. Carry out a hypothesis test to find out if mildly obese people increase the time they spend standing and walking when they lose weight.
13.1: Comparing 2 means • Comparing 2 populations or treatments: most common statistical practice. • Types of 2-sample problems: 1) Randomized comparative experiment that randomly divides subjects into 2 groups and exposes each group to a different treatment 2) Comparing random samples separately selected from 2 populations
Notation to describe the 2 populations • Population • Variables • Mean • Standard deviation • Sample size • Sample means • Sample standard deviations
The sampling distribution of • The difference of sample means is an unbiased estimator of the difference of population means • The variance of the difference is the sum of the variances of and • If the two population distributions are both normal, then the distribution of the sample means is also normal.
2-sample z/t test statistic • Because has a normal distribution, we can standardize it to obtain a standard normal z statistic:
Because we don’t know and , we follow the pattern of the one-sample case and use the sample std. dev.
Example • Does increasing the amount of calcium in our diet reduce blood pressure? Examination of a large sample revealed a relationship between calcium intake and blood pressure... The subjects in the experiment were 21 healthy black men. A randomly chosen group of 10 men received a calcium supplement for 12 weeks, and the control group of 11 men took a placebo….the response variable is the decrease in b.p. after 12 weeks; an increase appears as a negative response. • Group 1 = calcium group 7 -4 18 17 -3 -5 1 10 11 -2 • Group 2 = placebo group -1 12 -1 -3 3 -5 5 2 -11 -1 -3 1)Is this good evidence that calcium decreases blood pressure in the population more than a placebo does? 2) Find a 90% confidence interval for this prob.
In a study of heart surgery, one issue was the effect of drugs called beta-blockers on the pulse rate of patients during surgery. The available subjects were divided at random into two groups of 30 patients each. One group received a beta-blocker; the other group received a placebo. The pulse rate of each patient at a critical point during the operation was recorded. The treatment group had mean 65.2 and standard deviation 7.8. For the control group, the mean was 70.3 and the standard deviation was 8.3. 1. Perform an appropriate significance test to see if beta-blockers reduce the pulse rate. 2. Give a 99% confidence interval for the difference in mean pulse rates. Interpret the confidence interval you obtain.