Download
1 / 28
290 likes | 360 Views
Investigate the quality of Lidar products for shoreline mapping, exploring automated processes and algorithms to enhance accuracy, resolution, and efficiency. Understand the potential of Lidar in solving current shoreline challenges.

E N D
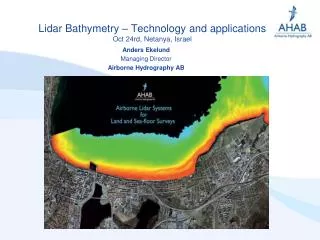
Development and Assessment of Airborne Lidar Bathymetry Products for Shoreline Mapping Shachak Pe’eri Center for Coastal and Ocean Mapping, University of New Hampshire Lynnette V. Morgan National Oceanic and Atmospheric Administration/ Center for Coastal and Ocean Mapping, University of New Hampshire Andrew A. Armstrong National Oceanic and Atmospheric Administration/ Center for Coastal and Ocean Mapping, University of New Hampshire Shallow Survey 2008
Nautical Charting and Hydrographic Surveying statisticallyderivedtidal datums Mean High Water (MHW) Mean Lower Low Water (MLLW) Coastal Management storm modeling damage assessment Inundation modeling Current uses for shoreline Shallow Survey 2008
? ? ? ? ? ? ? Current Shoreline Extraction • Current Methods • Aerial photogrammetry • Satellite photogrammetry • IR Imagery and stereoscopic imaging MHW Waterline MLLW SPOT satellite image of Santa Catalina Island in the near-infrared, March 15, 1990 (SPOT Image website, 2007) Shallow Survey 2008
Limitations Problematic MLLW extraction correlation with the statistical definitions variation introduced from individual operator interpretation Current sensor technology used for shoreline mapping passive imagery relies on the collection of signals from the ambient scene affected by environmental factors haze, clouds, and illumination conditions requires day-time acquisition and optimal weather conditions tide coordination required MLLW may not be visible Need for computerization of shoreline determination Current Method Limitations (Parker et al., 2001; Molander, 2001; Espey, 2003) Shallow Survey 2008
Investigate lidar-waveform algorithms to infer land or water from the laser measurements Create an automated process for shoreline vector production from SHOALS ALB data Investigate the quality of Lidar products for shoreline mapping, and answer the following: Can Lidar produce a Shoreline product that meets current standards? How does the resolution compare with other current shoreline products? Can it solve any of the current shoreline problems? Objectives of the Study Shallow Survey 2008
Laser pulse geometry: Green and Red Green (G) Channel Waveform Red (R) Channel Waveform Intensity Intensity Sea surface Sea floor Time Time Excited at 532 nm Shallow Survey 2008 (based on Guenther, 2001; Pe’eri et al., 2007)
Intensity Time Laser pulse geometry: IR excited at 1064 nm Infrared (IR) Channel Waveform Excited at 1064 nm Sea surface Sea floor Shallow Survey 2008
Algorithms • Current and new algorithms developed to determine land from water using ALB • IR-Saturation • (Guenther, 1985; Guenther et al., 1994) • IR-Red Ratio • (Pe’eri and Philpot, 2007) • Red Std Deviation • (Pe’eri et al., 2007) Shallow Survey 2008
Waveform Infrared Water Land Time (ns) Infrared-Saturation • examines the infrared (IR) channel waveform • for saturation at the receiver • duration of saturation, • algorithm uses number of time bins • (IRst) • Land • saturation • Water • no saturation • currently used in the SHOALS software (Guenther et al., 1994) Shallow Survey 2008
Waveforms Infrared Red Water Land Time (ns) Time (ns) IR-Red Ratio • Ratio of IR to Red • modified IR-Saturation algorithm • Land • high IR & weak Red • Water • higher R & low IR • Three variations • Ratio of maximum values - (IRRm) • Ratio of differences between maximum and minimum values - (IRRa) using all IR values - (IRRc) constrained (Pe’eri and Philpot, 2007) Shallow Survey 2008
Waveform Red Water Land Time (ns) Red Standard Deviation • Standard deviation of the red channel waveform examined • (Rsdv) • Land • low values • no return, just noise • Water • high values • peak in the red channel waveform from water Shallow Survey 2008
Algorithm sensitivity to environment; sandy, rocky, man-made Methodology CHARTS reference frame DT-4000 SHOALS-3000 JPG images Full waveforms (G,R, IR) XYZ Orthorectified ALB shorelines Georefrenced Digitized shorelines Comparison and evaluation Shallow Survey 2008
Seapoint, ME (north) – sandy beach Seapoint ME (south) – sand, pebble, cobble Calibration Site Newcastle Pier, NH – man-made Fort Point, NH – man-made/mixed Rye, NH – rocky shoreline/kelp Shoreline study sites USACE SHOALS-3000 survey September 30, 2005 Gerrish Island, ME and Portsmouth Harbor, NH Datum: WGS 1984 Shallow Survey 2008
Threshold Groupings Threshold • Determine appropriate threshold • indicating the break between land and water • Results two distinguishable groups • land and water return values Count # Group A Group B Numeric Algorithm Value Water Land 10 meters Shallow Survey 2008
Land-water contour Bend Simplify PAEK Smoothing Reference Shoreline Water Land 5 meters Generalization Techniques investigated • line smoothing - PAEK algorithm (Polynomial Approximation with Exponential Kernel) • line simplification – Bend Simplify Shallow Survey 2008
Aerial Photographs • collected simultaneously • with ALB data • DuncanTech (DT)-4000 • digital RGB camera • frames: 1600 x 1200 pixels (pxl) • down-sampled to 800 x 600 pxl • coincides with 0.4 x 0.4 m / pxl • orthorectified photographs • made available to this study • for each locality • delivered in geotiff format • WGS 1984 UTM Zone 19 North (Pe’eri and Rzhanov, 2008) Shallow Survey 2008
Operator 1 – initial (Reference Shoreline) Operator 1 – 2nd run Operator 2 Operator 3 Manual digitization of shorelines 1:400 • All images were digitized at a 1:400 scale Shallow Survey 2008
Reference IR-R all IR-R con IR-R max IR sat R_Stdv 20 meters Fort Point, NH Shallow Survey 2008
Seapoint, ME (south Beach) Reference IR-R all IR-R con IR-R max IR sat R_Stdv 20 meters Shallow Survey 2008
Reference IR-R all IR-R con IR-R max IR sat R_Stdv 20 meters Rye, NH Shallow Survey 2008
Reference IR-R all IR-R con IR-R max IR sat R_Stdv 20 meters Newcastle, NH - Pier Shallow Survey 2008
Smoothing algorithms Algorithm Vector using Smoothing - PAEK with a 20m smoothing tolerance Shallow Survey 2008
20 meters 1 : 800 20 meters Smoothing algorithms Algorithm Vector using Smoothing - PAEK with a 20m smoothing tolerance Shallow Survey 2008
Conclusions • The produced land-water interface vectors showed good correlation in comparison to the digitized-reference shorelines. • Four out of the 5 algorithms produce viable land-water interfaces • (IR-sat, IR-R all, IR-Rcon. IR-R max) • A line generalization (PAEK algorithm) • It seems that line smoothing (20 m window) technique can potentially be applied for masking out some of the algorithm noise and providing a charting product – further work is required. Shallow Survey 2008
MHW Inundation model Land-water Interface MLW Discussion • Comprehensive littoral model Shallow Survey 2008
Future work • Examine SHOALS data collected with tighter spot spacing and 200% coverage • Comparison of ALB shoreline (tide-coordinated) with NGS MHW • Along with field verification • Determine best generalization technique for production and tolerance to use Shallow Survey 2008
Thanks USACE - JALBTCX NOAA-NGS NOAA-OCS USM/Optech International Shallow Survey 2008
Shoreline Shoreline Shoreline High tide Questions? The shoreline is defined as the boundary between the ocean and land. Low tide Help! Shallow Survey 2008