GRAPHING RULES
GRAPHING RULES. The purposes of creating graphs are to: Display data in a different format Make it easier for you to see patterns, trends and relationships. While are there are several types of graphs, the types of graphs we will focus on this year will be: bar graphs line graphs

GRAPHING RULES
E N D
Presentation Transcript
GRAPHING RULES • The purposes of creating graphs are to: • Display data in a different format • Make it easier for you to see patterns, trends and relationships. • While are there are several types of graphs, the types of graphs we will focus on this year will be: • bar graphs • line graphs • line plots (sometimes called pictographs)
Bar Graphs • Normally used to compare categorical, ordered, or discrete variables. These changes are NOT continuous. • Categorical variables—described by a word label, not a number (e.g. different brands of paper towels or types of animals at the zoo) • Ordered variable-these are categorical variables that can be put in order (e.g. cool, warm, hot) • Discrete variables- describe by whole numbers only (e.g. 1, 2, 3 teaspoons) • Bar graphs are useful to get an overall idea of trends in responses • Often used to display data for polls and surveys
When is it best to choose to draw a bar graph? • When you are comparing the total number of things (such as data from surveys, polls or discrete measurements)
That’s right…it had no title or labels on axes Weight (lbs) Type of Trash
Double (or triple) Bar Graph • Double (or triple) bar graphs are also used to show and compare total number of things, but each group of data is divided into two (or three) • Because you are comparing more than one group of data, you should have a key.
Line Graphs • Often used to show a change over a period of time When is it best to choose to draw a line graph? • Show the relationships between the independent and dependent variables (how the DV responds to the IV)
Single or multiple line graphs • use a single line when you are showing only one variable level • Multiple (two, three, four, etc.) line graphs are also used to show the relationship between the variables, but each independent variable level is shown. • Because you are comparing more than one group of data, you should have a key.
Single line graph • The independent variable in graph A is ____________________ • The dependent variable in graph A is ____________________
Multiple line graph • The independent variable in graph B is ____________________ • The dependent variable in graph B is ____________________ • The different levels/groups in graph B are _________________ and ____________________ • 4. How did you figure out the groups? • ____________________
shows the frequency of data along a horizontal number line (x-axis) plots data on a number line with a symbol (x) above the numbers The number of x's above each number/amount indicates how many times each number/amount occurred. Note: There is no y-axis for this type of graph Original source: http://ellerbruch.nmu.edu/classes/cs255w03/cs255students/nsovey/p5/p5.html (modified by J. Solari on 10/12) Line Plots- for what are they used?
When is it best to use a line plot? It is best to use a line plot (instead of a bar graph) when you want to show the frequency (how often something occurs).
How to read a line plot • Line plots allow several features of the data to become more obvious. For example, outliers, clusters, and gaps are apparent. • Outliersare data points whose values are significantly larger or smaller than other values • Clusters are isolated groups of points • Gapsare large spaces between points Ages of people who live in the apartment building Original source: http://ellerbruch.nmu.edu/cs255/jnord/lineplot.html, modified by J. Solari 10/12/10
How to create a line plot • Once data is collected it is then time to make a line plot. • 1. Determine the scale to be used. If the data is best described in 100's have the scale increase by hundreds, if all the data can fit on a scale 0-10 then make it 0-10. • 2. Next draw a horizontal line across the paper (x-axis). • 3. Break the line into EQUAL parts that will hold your scale. • 4. List the data. Place an X over the correct number for each of the datum collected. If a number is repeated then place the X above the other. • 5. Label the x-axis and give it an appropriate title
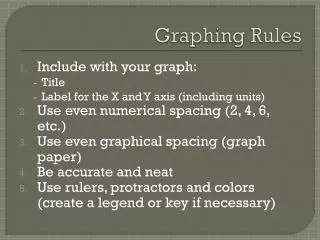
Graphing Rules • Use a bar graph when making comparison of data and a line graph to show continuous change over time. 1. Draw the axes • Use the entire graph paper to set up x- and y-axes. Margins below x-axis and next to y-axis should be no larger than one inch (about 2.5 cm). • Be Neat.Use a ruler to draw margins. 2. Identify the variables a. The x-axis is horizontal axis and the y-axis is the vertical axis. • The x-axis represents the independent variable • The y-axis represents the dependent variable
Graphing Rules, continued 3. Determine a Scale for Each Axis Your goal in determining a scale for the axes is to fit the entire range of data over the available space on the graph paper. To select an appropriate scale, you need to: • Determine the variable range (max-min) for each axis. • Count the number of (blue) lines along the x and y axes. Each line represents an interval. • Divide the # of Intervals by the range (I/R) and round down to nearest number.
Graphing Rules, continued 4. Number and Label each Axis • Mark the scale values on each axis • Label each axis with the type of data and unit
5. Plot the data points and Draw the Graph • On a line graph: 1) plot each pair of data values (dependent-independent pair) on the graph with a dot 2) draw a curve or line that best fits the data points (using a ruler). 3) you may have multiple sets of dependent-independent data. If so, use a different color to plot each set of data pairs. • On a bar graph: make all bars the same width, evenly space out the bars (not touching). If you are creating a multiple bar graph, the sets of data which belong to each category on x-axis can touch the bars in the same set. color or shade the bars differently for each category on x-axis
6. Include a Key, if necessary • Place in upper right or left hand corner of graph; use when graphing two or more sets of data (multiple bar or line graph) to identify all of the groups or variable levels. • Use different colored pencils to represent the different groups or variable levels.
Title your graph It should clearly describe the information (data/experimental results). Place title at top-center of graph. (“The Effect of IV on DV” or IV vs. DV)