Download
1 / 1
10 likes | 113 Views
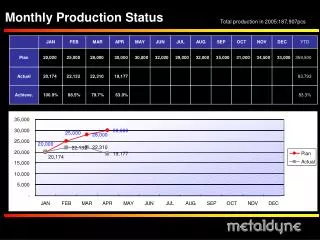
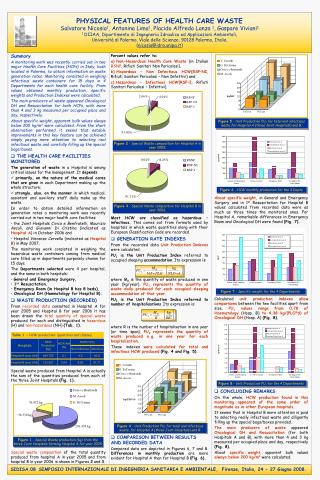
Analysis of special waste production, composition, unit production rates, and physical features in hospitals A and B in Italy for 2005-2006. Detailed data on infectious and non-infectious healthcare waste. Presented at SIDISA 08 International Symposium.

E N D
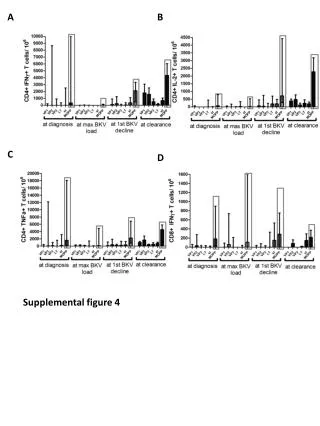
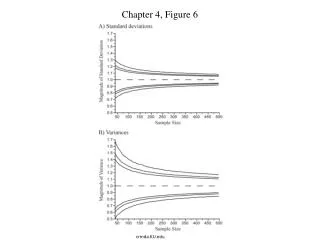
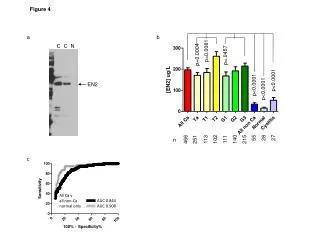
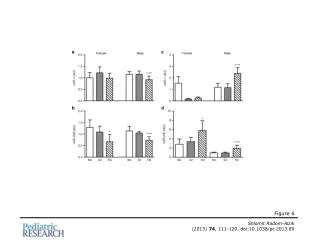
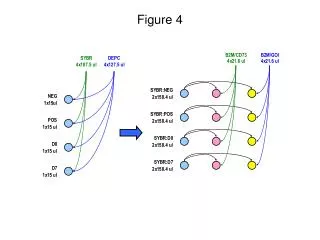
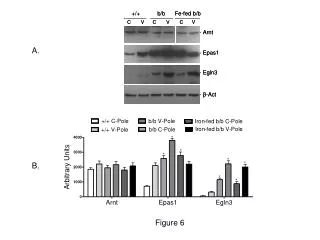
Figure 1 - Special Waste production (kg) from the three Joint Hospitals forming Hospital A for year 2005. Figure 5 - Unit Production PU2 for total and infectious waste for Hospital A (three Joint Hospitals) and B. Figure 2 - Special Waste composition for Hospital A in year 2005. Figure 6 - HCW monthly production for the 4 Depts. Figure 7 - Specific weight for the 4 Departments. Figure 3 - Special Waste composition for Hospital B in year 2006. Figure 8 - Unit Production PU1 for the 4 Departments. Table 1 -HCW production: quantities and classes. Hospitals HCW Production [kg] HCW-NH [%] HCW-H [%] Non-Infectious Infectious Hospital A (year 2005) 424.766 2,1 4,0 93,9 Hospital B (year 2006) 133.921 0,04 8,25 91,71 Figure 4 - Unit Production PU1 for total and infectious waste, for Hospital A (three Joint Hospitals) and B. PHYSICAL FEATURES OF HEALTH CARE WASTESalvatore Nicosia1, Antonina Lima1, Placido Alfredo Lanza 1, Gaspare Viviani11 DIIAA, Dipartimento di Ingegneria Idraulica ed Applicazioni Ambientali, Università di Palermo, Viale delle Scienze, 90128 Palermo, Italia.(nicosia@idra.unipa.it) SIDISA.08SIMPOSIO INTERNAZIONALE DI INGEGNERIA SANITARIA E AMBIENTALE, Firenze, Italia, 24 - 27 Giugno 2008.