Download
1 / 1
10 likes | 131 Views
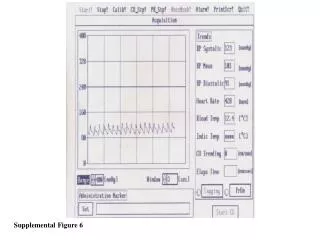
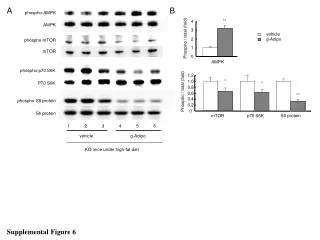
This study examines the effects of g-Adipo on phospho-AMPK, mTOR, and downstream signaling in KO mice subjected to a high-fat diet. We evaluated changes in key phosphorylation states, including phospho-p70 S6K and phospho-S6 protein levels, providing insights into the regulatory mechanisms influenced by g-Adipo. Data from supplemental figure 6 illustrate the differences in signaling pathways in response to g-Adipo treatment compared to vehicle controls, highlighting potential therapeutic targets for enhancing metabolic health.

E N D
* * A B phospho-AMPK ** 4 AMPK 3 vehicle g-Adipo Phospho / total (fold) phospho-mTOR 2 1 mTOR 0 AMPK phospho-p70 S6K 1.2 1.0 P70 S6K 0.8 Phospho / total (fold) 0.6 ** 0.4 phospho-S6 protein 0.2 0 S6 protein mTOR p70 S6K S6 protein 1 2 3 4 5 6 vehicle g-Adipo KO mice under high-fat diet Supplemental Figure 6