Download
1 / 81
810 likes | 1.06k Views
ECOWAS’s Infrastructure: A Regional Perspective. Africa Infrastructure Country Diagnostic: a multi-stakeholder effort. Methodology and approach. Methodology Data collection by local/international consultants and Bank staff based on standardized methodology

E N D
Africa Infrastructure Country Diagnostic:a multi-stakeholder effort
Methodology and approach • Methodology • Data collection by local/international consultants and Bank staff based on standardized methodology • Baseline year for data is 2006, does not reflect subsequent evolution • Approach • Focus on benchmarking ECOWAS’s infrastructure against other African RECs and benchmarking ECOWAS member countries with each other
Key Message #1 Infrastructure could be contributing much more to West Africa’s growth
Infrastructure contributed one percentage point to West Africa’s recent growth spurt
Catching-up on infrastructure could boost growth by five percentage points
Key Message #2 West Africa’s economic geography makes regional integration particularly critical
The burden of geography • Small countries unable to reap scale economies • 11 have economies <$5 billion • 8 have populations <10 million • Countries isolated from key resources • 6 rely on transnational river basins • 3 are landlocked relying on regional road corridors • Economic activity concentrated along coast
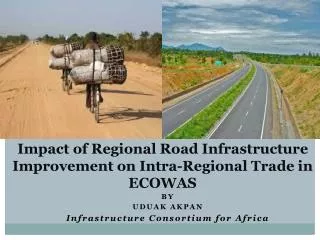
Key Message #3 Soft issues are the main culprits for West Africa’s slow and expensive road freight
Road freight transport is particularly slow and expensive in West Africa
Corridors are almost entirely paved and mainly in reasonable condition
Only two of the corridors register reasonably high volumes of traffic
Rail transport appears to be more competitive on parallel corridors
Administrative and waiting costs add at least $20 per ton to costs of exporting via sea ports
Administrative and waiting costs weigh even more heavily on imports
Key Message #4 Coastal countries appear to be neglecting roads on sea corridors
Traffic flows along broader regional road network
Some 80 percent of broader regional roads in reasonable condition
Key Message #5 West Africa’s railways do not readily form a regional network
West Africa’s disparate rail networks make use of multiple incompatible gauges
Operational performance of West African rail operators is relatively poor
Key Message #6 West Africa lacks a functional transshipment hub
Wide range of performance across West Africa’s ports
Key Message #7 Major progress with liberalization but safety remains a concern
ECOWAS performs below African comparators on several air transport benchmarks
Uneven development of air connectivity across Western and Eastern sides of continent
Regional air traffic heavily concentrated on Accra to Lagos route
Most countries have daily flight to one of region’s significant airports
Major shift in fleet size towards Citi jets and commuter propeller planes
Differential responses to collapse of major regional carriers
West Africa has made most progress with air transport liberalization
Huge shifts in market share have taken place in recent years
Airport charges in West Africa are significantly higher than international standards
Key Message #8 Regional power trade could save US$0.5 billion annually as well as 5 million tons of CO2
Power is widely accessible but highly expensive and unreliable
Only 70 percent of the effective demand for power is being met
Today there are two major power traders: Cote d’Ivoire and Ghana
Deepening regional power trade saves WAPP half a billion dollars annually (about 3%)
Trade expansion would boost volume of power traded from 5 TWh to over 15 TWh Trade Stagnation Trade Expansion