Download
1 / 34
380 likes | 462 Views
Learn about the theory of measurement scales by psychologist Stanley Smith Stevens, including nominal, ordinal, interval, and ratio scales. Understand how these scales classify data and the types of statistics that can be applied to each. Explore examples and practical applications.

E N D
Measurement Scales “If a thing exists, it exists in some amount; and if it exists in some amount, it can be measured.” –E. L. Thorndike (1914)
Background • The "levels of measurement" is an expression which typically refers to the theory of scale types developed by the psychologist Stanley Smith Stevens. • Stevens proposed his theory in a 1946 article titled "On the theory of scales of measurement”. • In this article Stevens claimed that all measurement in science was conducted using four different types of numerical scales which he called "nominal", "ordinal", "interval" and "ratio".
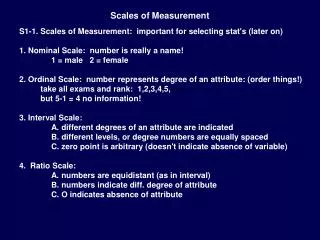
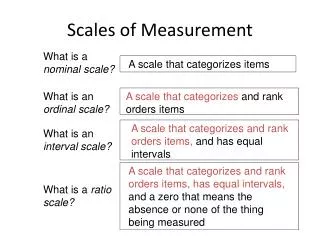
The Theory Of Scale Types Stevens (1946, 1951) proposed that measurements can be classified into four different types of scales. These were: • Nominal • Ordinal • Interval • Ratio
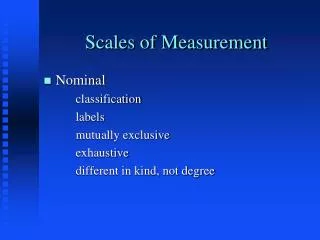
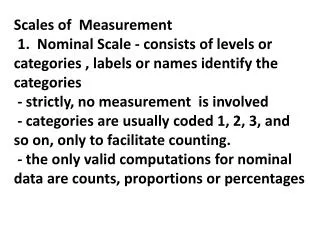
Nominal Scale • A categorical variable, also called a nominal variable, is for mutual exclusive, but not ordered, categories. • Nominal scales are mere codes assigned to objects as labels, they are not measurements. • Not a measure of quantity. Measures identity and difference. People either belong to a group or they do not. • Sometimes numbers are used to designate category membership.
Examples • Eye color: blue, brown, green, etc. • Biological sex (male or female) • Democrat, republican, green, libertarian, etc. • Married, single, divorced, widowed • Country of Origin • 1 = United States 3 = Canada • 2 = Mexico 4 = Other (Here, the numbers do not have numeric implications; they are simply convenient labels)
Ordinal Scale • This scale has the ability to rank the individual attributes of to items in same group but unit of measurement is not available in this scale, like student A is taller than student B but their actual heights are not available. • Designates an ordering: greater than, less than. • Does not assume that the intervals between numbers are equal.
Examples • Rank your food preference where 1 = favorite food and 4 = least favorite: ____ sushi ____ chocolate ____ hamburger ____ papaya • Final position of horses in a thoroughbred race is an ordinal variable. The horses finish first, second, third, fourth, and so on. The difference between first and second is not necessarily equivalent to the difference between second and third, or between third and fourth.
Interval Scale • Classifies data into groups or categories • Determines the preferences between items • Zero point on the internal scale is arbitrary zero, it is not the true zero point • Designates an equal-interval ordering. • The difference in temperature between 20 degrees f and 25 degrees f is the same as the difference between 76 degrees f and 81 degrees f.
Examples • Temperature in Fahrenheit is interval. • Celsius temperature is an interval variable. It is meaningful to say that 25 degrees Celsius is 3 degrees hotter than 22 degrees Celsius, and that 17 degrees Celsius is the same amount hotter (3 degrees) than 14 degrees Celsius. Notice, however, that 0 degrees Celsius does not have a natural meaning. That is, 0 degrees Celsius does not mean the absence of heat! • Common IQ tests are assumed to use an interval metric.
Examples Likert scale: How do you feel about Stats? 1 = I’m totally dreading this class! 2 = I’d rather not take this class. 3 = I feel neutral about this class. 4 = I’m interested in this class. 5 = I’m SO excited to take this class!
Ratio Scale • This is the highest level of measurement and has the properties of an interval scale; coupled with fixed origin or zero point. • It clearly defines the magnitude or value of difference between two individual items or intervals in same group.
Examples • Temperature in Kelvin (zero is the absence of heat. Can’t get colder). • Measurements of heights of students in this class (zero means complete lack of height). • Someone 6 ft tall is twice as tall as someone 3 feet tall. • Heart beats per minute has a very natural zero point. Zero means no heart beats.
Level of measurement Put data in categories Arrange data in order Subtract data values Determine if one data value is a multiple of another Summary of Levels of Measurement Nominal Yes No No No Ordinal Yes Yes No No Interval Yes Yes Yes No Ratio Yes Yes Yes Yes
A professor is interested in the relationship between the number of times students are absent from class and the letter grade that students receive on the final exam. He records the number of absences for each student, as well as the letter grade (A,B,C,D,F) each student earns on the final exam. In this example, what is the measurement scale for number of absences? • Nominal b) Ordinal c) Interval d) Ratio
In the previous example, what is the measurement scale of letter grade on the final exam? a) Nominal b) Ordinal c) Interval d) Ratio
Nature of Attitudes • Cognitive I think oatmeal is healthier than corn flakes for breakfast. • Affective Behavior I hate corn flakes. • Behavior I intend to eat more oatmeal for breakfast.
Selecting a Measurement Scale • Research objectives • Response Types • Data properties • Number of Dimensions • Forced or unforced choices • Balanced or unbalanced • Rater errors • Number of scale points
Response Types • Rating Scale Estimates magnitude of a characteristic • Ranking Scale Rank order preference • Categorization Selection of preferred alternative • Sorting Arrange or classify concepts
Rating Asks the respondent to estimate the magnitude of a characteristic, or quality, that an object possesses. The respondent’s position on a scale(s) is where he or she would rate an object.
Response TypeRating 1. Simple Category: i. Dichotomy ii. Multiple choice – single response iii. Multiple choice – multiple responses 2. Likert 3. Semantic Differential 4. Numerical/Multiple Rating List 5. Staple 6. Constant-Sum 7. Graphic Rating
Ranking Tasks require that the respondent rank order a small number of objects in overall performance on the basis of some characteristic or stimulus.
Sorting Might present the respondent with several concepts typed on cards and require that the respondent arrange the cards into a number of piles or otherwise classify the concepts.
Categorization Between two or more alternatives is another type of attitude measurement - it is assumed that the chosen object is preferred over the other.