Download

1 / 213
5.4k likes | 13.43k Views
Measurement Scales. Measurement : The assignment of Numbers or other symbols to characteristics of objects according to certain pre-specified rules. Scaling: The generation of a continuum upon which measured objects are located. . Primary Scales of Measurement .

E N D
Measurement Scales • Measurement : The assignment of Numbers or other symbols to characteristics of objects according to certain pre-specified rules. • Scaling: The generation of a continuum upon which measured objects are located.
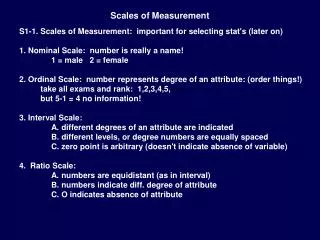
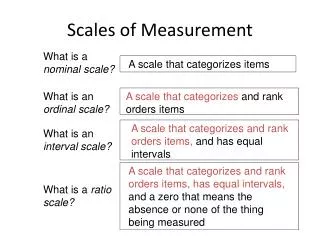
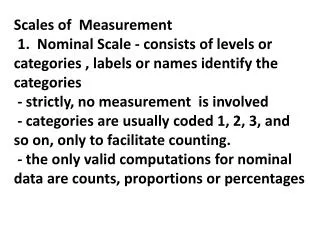
Primary Scales of Measurement There are 4 kinds of scales namely: • Nominal scale • Ordinal scale • Interval scale • Ratio scale
Nominal scale • In this scale numbers are used to identify objects. For example University Registration numbers assigned to students. • Have you visited Bangalore? • Yes-1, No-2 • Yes is coded as one and No is coded as Two. The numeric attached to the answers has no meaning and is a mere identification. • If the numbers are interchanged it wont affect the answer.
Example for nominal scale • The telephone number is a example of nominal scale where one number is assigned to one subscriber. • Similarly bus route numbers are examples of nominal scale. • “How old are you? This is an example of nominal scale. • “What is your PAN Card Number? • Arranging the books in the library subject wise, author wise
Limitations • There is no rank ordering. • No mathematical operation is possible. • Statistical implication- calculation of standard deviation and the mean is not possible
Ordinal scale (ranking scale) • The ordinal scale is used for ranking in most of market research studies. • Ordinal scales are used to ascertain the consumer perceptions, preferences etc. • This is also known as ranking scale
Example of ordinal scale • The respondents may be given a list of brands which may be suitable and were asked to rank on the basis of ordinal scale. • Lux • Liril • Cinthol • Lifebuoy • Hamam
Nominal scale- contd • In the previous example II is the mode and III is the median. • In market research the researchers often ask the respondents to rank the items like for example “A soft drink based upon flavor or Color”. • In such cases the ordinal scale is used
Interval scale • Interval scale is more powerful than the nominal and ordinal scale. • The distance given on the scale represents equal distance on the property being measured. • Interval scale may tell us “How far object are apart with respect to an attribute?” • This means that the difference can be compared. • The difference between 1 and 2 is equal to the difference between 2 and 3.
Eg for interval scale • Eg 1: Suppose we want to measure the rating of a refrigerator using interval scale it will appear as follows: • 1 Brand name Poor------------Good • 2 Price High-------------Low • 3 Service after sales Poor-----------Good • 4 Utility Poor----------Good
Interval scale-contd • The researcher cannot conclude that the respondent who gives rating of 6 is 3 times more favorable towards the product under study than the respondent who awards the rating of 2. • Eg 2: How many hours you spend to do class assignment every day? • <3o min • 3o min- 1 hr • 1 hr- 1.5 hr • 1.5 hr
Difference between nominal and ordinal scale • In nominal scale numbers can be interchanged because it serves only for the purpose of counting. Numbers in ordinal scale have meaning and it won’t allow interchangeability.
Difference between interval and ordinal scale • Ordinal scale gives only the ranking of the alternatives, one is greater than the other, but won’t give the differences/distances between one and other. Interval scales provide information about the difference between one and other.
Ratio scale • Ratio scale is a special kind of interval scale that has a meaningful zero point. With this scale, length, weight, or distance can be measured. In this scale it is possible to say, how many times greater or smaller one object is being compared to the other. • Example: sales this year for product A are twice the sales for the same product last year. • Statistical Implications: All statistical operations can be performed on this
Classification of Scaling Techniques • Comparative Scales: One of two types of scaling techniques in which there is direct comparison of stimulus objects with one another. • There are 4 types of comparative scaling namely: • Paired comparison • Rank order • Constant sum • Q-Sort and other procedures.
Classification of Scaling Techniques-Contd.. • Non-comparative scales: One of the two types of scaling techniques in which each stimulus object is called independently of other objects in stimulus set. • There are 2 types of Non-comparative scales namely: • Continuous ranking scales • Itemized ranking scales : consisting of three types namely: • Likert Scale • Semantic Differential • Stapel
Sampling • A sample is a part of a target population which is carefully selected to represent the population. • Sampling frame is the list of elements from which the sample is actually drawn. Actually sampling frame is nothing but the correct list of population. Example: telephone directory, product finder, yellow pages.
Distinction between Census and Sample • Census refers to complete inclusion of all elements in the population. A sample is a subgroup of the population. • Sampling unit: If individual respondents form the sample elements and if we directly select some individuals in a single step, the sampling unit is also the element. That is both the unit and the element are the same.
When Census is appropriate • When the size of the population is small. • Sometimes the researcher is interested in gathering information from every individual. Example: quality of food served in a mess.
When Sample is Appropriate • When the size of the population is large. • When time and cost are the main considerations in research. • If the population is homogeneous. • Also there are circumstances when census is not possible
Advantages of Sampling • Sampling reduces time and cost of research studies. • Sampling saves labor. • The quality of study is often better with sampling. • Sampling provides much quicker results. • Sampling is the only procedure possible if the population is infinite. • Statistical sampling gains a advantage over any other method.
Limitations of Sampling • Sampling demands through knowledge of sampling methods and procedures. • When the characteristics to be measured occurs rarely in the population, a very large sample is required to secure units that will give reliable information about it. • A complicated sampling plan requires more labor.
Sampling Process • It consists of seven steps: • Define the population • Identify the sampling frame • Specify the sampling unit • Selection of sampling method • Determination of sample size • Specify the sampling plan • Selection of sample
Types of Sampling Design • Sampling is divided in to 2 types: • Probability sampling • Non-Probability sample
Probability Sampling • Probability sampling: In probability sampling, every unit in the population has a equal chances for being selected as a sample unit. • The following are the characteristics: • Every population has a equal chance of being selected. • Such chance is known as probability. • Probability sampling yields a representative sample. • The closeness of a sample to the population can be determined by estimating the sample bias or error.
Non Probability Sampling • In the non probability sampling the units in the population have unequal or negligible , almost no chance for being selected as a sample unit. • Its merits are as follows: • It does not ensure a selection chance to each population unit • The selection probability is unknown • A non probability sample may not be a representative one. • Non probability sampling plan does not perform inferential function.
Probability Sampling Techniques • Simple random sampling • Stratified random sampling • Systematic random sampling • Cluster sampling • Area sampling • Multi-Stage and sub-sampling
Non-Probability Sampling Techniques • Convenience or accidental sampling • Purposive or deliberate or (Judgment) sampling • Shopping mall Intercept Sampling • Sequential sampling • Quota sampling • Snowball sampling • Panel samples
Random Sampling • Random sampling or simple random sampling is a process in which every item of the population has a equal probability of being chosen. • There are 2 methods used in the random sampling • A) lottery method • B) using random number tables
Advantages of Simple Random Sampling • All elements in the population have an equal chance of being selected. • Of all the probability sampling techniques simple random sampling is the easiest to apply. • It is the most simple type probability sampling to understand. • It does not require prior knowledge of true composition of the population. • The amount of sampling errors associated with any sample can be easily computed.
Disadvantages of simple random sampling • It is often impractical because of non availability of population list. • The use of simple random sample maybe wasteful if we fail to use all of known information. • It does not ensure proportionate representation of various groups constituting the population.
Systematic random sampling • There are 3 steps: • Sampling interval k determined by the following formula: K= No of units in the population/No of units desired in the sample One unit between the first and kth unit in the population list is randomly chosen. Add kth unit to the randomly chosen number
Stratified random sampling • A probability sampling procedure in which simple random sub-samples are drawn from within different strata, that are more or less equal on some characteristics. Stratified sampling are of 2 types: • Proportionate stratified sampling • Disproportionate stratified sampling
Stratified random sampling- contd • Sampling process is as follows: • The population to be sampled is divided into groups (stratified). • A simple random sample is chosen.
Reasons for Stratified Sampling • Marketing professionals want information about the component part of the population. • Stratified sampling can be carried out with • Same proportion across the strata proportionate stratified sample. • Varying proportion across the strata disproportionate stratified sample.
Cluster sampling • The following steps are followed: • The population is divided in to clusters. • A simple random sample of few clusters is selected. • All the units in the selected clusters are studied. • The major advantage of cluster sampling is the case of sample selection.
Cluster Sampling-Contd.. • Clustering is done on the basis of geographical area • Heterogeneity is secured within subgroups • Homogeneity is secured between subgroups • Random selection of subgroups or clusters is done.
Cluster sampling process • Identify clusters • Examine the nature of clusters • Determine the number of stages • A) single stage • B) two stage sampling • C) multi stage sampling
Area Sampling • This is a probability sampling, a special form of cluster sampling. • This is a important form of cluster sampling. • In larger field surveys, clusters consisting of specific geographical areas like districts, taluk, villages, or blocks in a city are randomly drawn. As the geographical areas are selected as sampling units in such cases, the sampling is called area sampling.
Area sampling-example • If someone wants to measure sale of a toffee in a retail stores, one might choose a city locality and then audit toffee sales in retail outlets in those localities. • The main problem in area sampling is the non -availability of lists of shops selling toffees in a particular area. Therefore, it would be impossible to choose a probability sample from these outlets directly. Thus the first job is to choose a geographical area and then list out the outlets selling toffee.
Multi Stage Sampling • The name implies that sampling is done in several stages. This is used with stratified/cluster design. • In this method the sampling is carried out in 2 or more stages. The population is regarded as being composed of a number of first stage sampling units. each of them is made up of number of second stage units and so forth. That is at each stage, a sampling unit is a cluster of the sampling unit of the subsequent stage.
Example of multi stage sampling • The management of a newly opened club solicits membership. During the first rounds, all corporates were sent details so that those who are interested may enroll. Having enrolled, the second round concentrates on how many are interested to enroll for entertainment activities that club offers such as billiards, indoor sports, swimming and gym etc. after obtaining the information, we might stratify the interested respondents. This will also inform about the reaction of new members.
Advantages and limitations of multistage sampling • Advantages: • It results in concentration of fieldwork in small areas. • Savings in cost, time labor and money. • Limitations: • Procedure of estimating sampling error • Cost advantage is complicated.
Sub sampling • Sub sampling is a part of multi stage sampling process. • In multistage sampling the sampling in second and subsequent stage frames is called sub sampling
Non-Probability Sampling Convenience or Accidental Sampling • This is a non-probability sampling • It means selecting a sample units in a just hit and miss fashion, example: interviewing people whom we happen to meet. • This sampling also means selecting whatever sampling units are conveniently available. • Example: A teacher may select students in his class • This is also known as accidental sampling because the respondents whom the researcher selects are accidentally included in the sample.
Advantages and Limitations • Advantages: • Cheapest and simplest method • It does not require list of population • It does not require any statistical expertise • Limitations: • Highly biased • Least reliable sampling method • The findings cannot be generalized
Purposive or Deliberate Sampling • This is also known as judgment sampling • The investigator uses his discretion in selecting sample observations from the universe. • This method involves selection of cases which we judge as the most appropriate ones for the given study. • The investigator chooses the sample that may be true representative of the universe.
Purposive Sampling-Contd.. • Example: Test market cities for the launch of an new product is being selected on the basis of judgment sampling, because these cities are viewed as typical cities matching with certain demographic characteristics. • Example: A researcher may deliberately choose industrial undertakings in which quality circles are believed to be functioning successfully and undertakings in which quality circles are believed to be total failure.