Download
1 / 46
520 likes | 1.11k Views
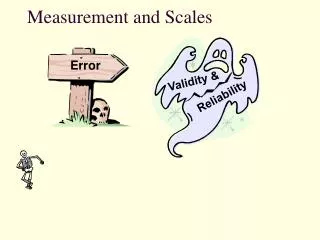
Measurement and Scales. Error . Validity &. Reliability. Measurement. Measurement and Measurement Scales. Measurement Process of assigning numbers or labels to things in accordance with specific rules to represent quantities or qualities of attributes.

E N D
Measurement and Scales Error Validity & Reliability
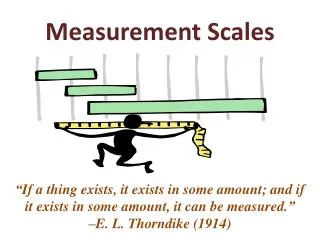
Measurement and Measurement Scales • Measurement • Process of assigning numbers or labels to things in accordance with specific rules to represent quantities or qualities of attributes. • Rule: A guide, method, or command that tells a researcher what to do. • Scale: A set of symbols or numbers constructed to be assigned by a rule to the individuals (or their behaviors or attitudes) to whom the scale is applied.
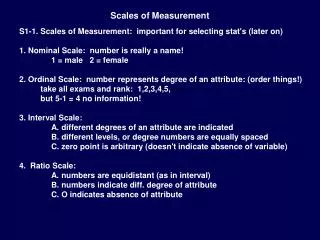
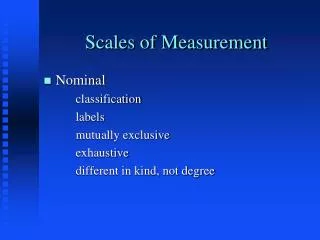
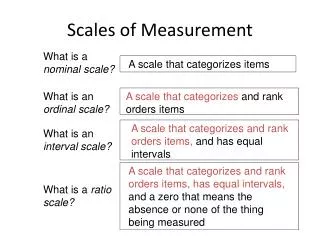
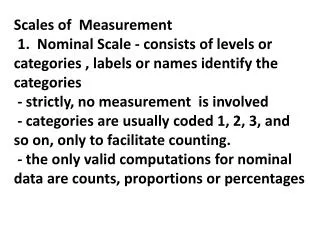
Types of Measurement Scales • Nominal Scales • Scales that partition data into mutually exclusive and collectively exhaustive categories. • Ordinal Scales • Nominal scales that can order data.
Interval Scales • Ordinal scales with equal intervals between points to show relative amounts; may include an arbitrary zero point. • Ratio Scales • Interval scales with a meaningful zero point so that magnitudes can be compared arithmetically.
Nominal Show Win Place Ordinal Interval 1 length 2 lengths Ratio 40 to 1 long-shot pays $40
Error in Survey Research • Random Sampling Error (Random error) • Error that results from chance variation • Impact can be decreased by increasing sample size and through statistical estimation (confidence interval) or “rule of thumb” • Systematic Error (non sampling error) • Error that results for the research design or execution.
Types of Systematic Error 1. Administrative Error • Error that results from improper execution. • Data Processing Error • Quality of data depends on quality of data entry. • Use of verification procedures can minimize
Sample Selection Error • Systematic error resulting from improper sampling techniques either in design or execution. • Interviewer Error • Data recorded incorrectly (error or selective perception). • Interviewer Cheating • Mitigate by random checks
2. Respondent Error • Humans interviewing humans... • Non-response error • Statistical difference between a survey that includes only those who responded and a survey that also includes those who failed to respond. • Non-respondent: person not contacted or who refuses to participate • Self selection bias: extreme positions represented
Response bias • Errors that result from tendency to answer in “a certain direction”. • Conscious or unconscious misrepresentation • Types: • 1. Deliberate falsification (why?)
Why would people deliberately falsify data • Appear to be what they are not • Don’t trust confidentiality • Protect • To end the interviewer quicker • “Average man effects”
Types of response bias continued: • 1. Deliberate falsification • 2. Unconscious misrepresentation
Reasons for unconscious misrepresentation: • Question format • Question content • Misunderstanding of question leading to biased answer • Lack of time to consider answer fully • Communication or semantic confusion • other
Types of response bias • Acquiescence bias: individuals have a tendency to agree or disagree with all questions or to indicate a positive/negative connotation • Extremity bias: results for response styles varying from person to person; some people tend to use extremes when responding to questions
Types of response bias continued... • Interviewer bias: Bias in the responses of the subject due to the influence of the interviewer • Auspices bias: respondents being influenced by the organization conducting the study • Social desirability bias: caused by respondents’ desire, either consciously or unconsciously to gain prestige or to appear in a different social role
Reliability, Validity and Correlation are concepts which are easy to confuse because the numbers used to represent them are so similar This is because Validity and Reliability are largely based on the Correlation Statistic Validity and Reliability are closely related Correlation, Validity and Reliability
What is Correlation? It is one way to measure the relationship between two variables It answers questions like: Is the relationship linear (straight-line)? Does the value of y depend upon the value of x or vice versa? How strong is the relationship, do the points form a perfect line? To measure the relationship we calculate the Correlation Coefficient Misconceptions: An insignificant result doesn’t mean there is no relationship, it is just not linear. The Correlation Coefficient does not measure the slope of the relationship Correlation, Validity and Reliability
The Correlation Coefficient The Correlation Coefficient has the following attributes: It can take a value in the range of -1 to +1 It is dimension less, i.e. its value is independent of the units of y and x Its value is independent of the measurement scales of x and y Methods to measure the correlation are Spearman (r) rho (nonparametric, ordinal data) Kendall Tau Correlation (nonparametric, ordinal data) Pearson’s (Product Moment) Correlation (parametric, interval or ratio data) Examples of values of Correlation Coefficient (r): = +1 =0 ≈ -0.6 Correlation, Validity and Reliability
What is Validity? Validity is concerned with whether we are measuring what we say we are measuring A measure is valid when the differences in observed scores reflect true differences on the characteristics one is attempting to measure and nothing else. X0=XT There are different kinds of validity Most of these use the correlation coefficient as a measure Correlation, Validity and Reliability
What is Reliability? A Measure is reliable to the extent that independent but comparable measures of the same trait or construct of a given object agree. In research, the term reliability means "repeatability" or "consistency" Reliability is a necessary but not sufficient condition for validity A test is said to be reliable if it consistently yields the same results Example: Correlation,Validity and Reliability For instance, if the needle of the scale is five pounds away from zero, I always over-report my weight by five pounds. Is the measurement consistent? Yes, but it is consistently wrong! Is the measurement valid? No! (But if it under-reports my weight by five pounds, I will consider it a valid measurement)
Types of Validity? Correlation, Validity and Reliability
Validity vs. Reliability? There are different conceptions of the relationship of Validity and Reliability which developed over time If a measure is valid it is also reliable? Illustrative Example: Target Metaphor Correlation,Validity and Reliability
Types of Reliability? There are 4 types of Reliability: Inter-Rater or Inter-Observer ReliabilityUsed to assess the degree to which different raters/observers give consistent estimates of the same phenomenon. Test- Retest ReliabilityUsed to assess the consistency of a measure from one time to another. Parallel-Forms ReliabilityUsed to assess the consistency of the results of two tests constructed in the same way from the same content domain. Internal Consistency ReliabilityUsed to assess the consistency of results across items within a test. sometimes referred to as homogeneity Correlation,Validity and Reliability
Internal ConsistencyReliability? There are different ways to measure Reliability: Average Inter-item Correlation Average Item-total Correlation Split-Half Reliability Cronbach's Alpha (α) May be used to describe the reliability of factors extracted from dichotomous (that is, questions with two possible answers) and/or multi-point formatted questionnaires or scales (i.e., Likert scales) Cronbach's alpha measures how well a set of items (or variables) measures a single unidimensional construct The theory behind it is that the observed score is equal to the true score plus the measurement error (Y = T + E) A reliable instrument should minimize the measurement error so that the error is not highly correlated with the true score Correlation,Validity and Reliability
Cronbach’s Alpha Coefficient? The Alpha Coefficient has the following attributes: Alpha coefficient ranges in value from 0 to 1 The higher the score, the more reliable the generated scale Nunnaly (1978) has indicated 0.7 to be an acceptable reliability coefficient but lower thresholds are sometimes used in the literature. It is a common misconception that if the Alpha is low, it must be a bad test. Correlation,Validity and Reliability
Sorting • Respondent indicates their attitudes or beliefs by arranging items. Example: Please sort the following cards with pictures of cookies into the following categories Like Dislike Neither like nor dislike
Decisions • Ranking, sorting, rating or choice? • How many categories or response positions? • Balanced or unbalanced? • Forced choice or nonforced choice? • Single measure or index?
Why these three concepts? Reliability, Validity and Correlation are concepts which are easy to confuse because the numbers used to represent them are so similar This is because Validity and Reliability are largely based on the Correlation Statistic Validity and Reliability are closely related Correlation, Validity and Reliability
What is Correlation? It is one way to measure the relationship between two variables It answers questions like: Is the relationship linear (straight-line)? Does the value of y depend upon the value of x or vice versa? How strong is the relationship, do the points form a perfect line? To measure the relationship we calculate the Correlation Coefficient Misconceptions: An insignificant result doesn’t mean there is no relationship, it is just not linear. The Correlation Coefficient does not measure the slope of the relationship Correlation, Validity and Reliability
The Correlation Coefficient The Correlation Coefficient has the following attributes: It can take a value in the range of -1 to +1 It is dimension less, i.e. its value is independent of the units of y and x Its value is independent of the measurement scales of x and y Methods to measure the correlation are Spearman (r) rho (nonparametric, ordinal data) Kendall Tau Correlation (nonparametric, ordinal data) Pearson’s (Product Moment) Correlation (parametric, interval or ratio data) Examples of values of Correlation Coefficient (r): = +1 =0 ≈ -0.6 Correlation, Validity and Reliability
What is Validity? Validity is concerned with whether we are measuring what we say we are measuring A measure is valid when the differences in observed scores reflect true differences on the characteristics one is attempting to measure and nothing else. X0=XT There are different kinds of validity Most of these use the correlation coefficient as a measure Correlation, Validity and Reliability
What is Reliability? A Measure is reliable to the extent that independent but comparable measures of the same trait or construct of a given object agree. In research, the term reliability means "repeatability" or "consistency" Reliability is a necessary but not sufficient condition for validity A test is said to be reliable if it consistently yields the same results Example: Correlation,Validity and Reliability For instance, if the needle of the scale is five pounds away from zero, I always over-report my weight by five pounds. Is the measurement consistent? Yes, but it is consistently wrong! Is the measurement valid? No! (But if it under-reports my weight by five pounds, I will consider it a valid measurement)
Types of Validity? Correlation, Validity and Reliability
Validity vs. Reliability? There are different conceptions of the relationship of Validity and Reliability which developed over time Churchill mentions in his article for example that if a measure is valid it is also reliable. (pg. 65) This view has been contradicted in the more recent literature (Moss, 1994, who mentions there can be validity without reliability) Illustrative Example: Target Metaphor Correlation,Validity and Reliability
Types of Reliability? There are 4 types of Reliability: Inter-Rater or Inter-Observer ReliabilityUsed to assess the degree to which different raters/observers give consistent estimates of the same phenomenon. Test- Retest ReliabilityUsed to assess the consistency of a measure from one time to another. Parallel-Forms ReliabilityUsed to assess the consistency of the results of two tests constructed in the same way from the same content domain. Internal Consistency ReliabilityUsed to assess the consistency of results across items within a test. sometimes referred to as homogeneity Correlation,Validity and Reliability
Ways to measure Internal ConsistencyReliability? There are different ways to measure Reliability: Average Inter-item Correlation Average Item-total Correlation Split-Half Reliability Cronbach's Alpha (α) May be used to describe the reliability of factors extracted from dichotomous (that is, questions with two possible answers) and/or multi-point formatted questionnaires or scales (i.e., Likert scales) Cronbach's alpha measures how well a set of items (or variables) measures a single unidimensional construct The theory behind it is that the observed score is equal to the true score plus the measurement error (Y = T + E) A reliable instrument should minimize the measurement error so that the error is not highly correlated with the true score Correlation,Validity and Reliability
Cronbach’s Alpha Coefficient? The Alpha Coefficient has the following attributes: Alpha coefficient ranges in value from 0 to 1 The higher the score, the more reliable the generated scale Nunnaly (1978) has indicated 0.7 to be an acceptable reliability coefficient but lower thresholds are sometimes used in the literature. It is a common misconception that if the Alpha is low, it must be a bad test. Correlation,Validity and Reliability