Download

1 / 17
170 likes | 262 Views
Explore the impact of macroeconomic changes on inequality in Ireland, focusing on income distribution, labor market dynamics, and tax-benefit policies. Utilizing dynamic microsimulation models to analyze trends and project future scenarios. Gain insights into the drivers of inequality and assess policy implications for welfare and economic equality.

E N D
Modelling the Impact of the Macro-Economic Change on Inequality: Ireland Cathal O’Donoghue, Jason Loughrey Teagasc Rural Economy and Development Programme (REDP) Karyn Morrissey University of Liverpool
Rapid Growth to 2007 • Big Fall post 2007 • GNP pc fell to 2000 levels in 2011 • Expenditure Increase 2007-2009 up 15% • Fall in Tax Revenues 2007-2010 down 33% Macro-economic Indicators GDP pc & GNP pc Both in Constant Prices (€per capita) Public Finance Source: CSO National Accounts
Lost most of the employment gain of Celtic Tiger • Disproportionately Young or Male • Employment rate of women under 35 higher than men in 2011 • Big falls in share of construction (50% fall in share amongst males) Employment Rate and Real Wage
Resulting Budget Constraint is lower and flatter • Poorer, but more equal Budget Constraint for a married couple with children 2005-2011(Adjusted for Wage Growth)
Price and Wage Inflation and Policy Updating (2007-2011) • Benefits rose by faster than CPI (UA – Jobseekers Allowance, OACP – State Pension (Insurance) • Significant earnings growth heterogeneity
Change in Gini Coefficient • Gini rose to peak in 2005, falling over 3 points between 2005 and 2008 with onset of crisis • Research Question – what drove fall in Gini (labour market participation, earnings variability, tax-benefit policy)? • What is the impact of later economics and policy changes Equivalised Disposable Income (parametric equivalence scale, 0.5)
Challenges • Fast moving economic situation • Significant policy changes need quick analysis • However data often produced at a lag of two years • However other data sources (LFS, Admin Data) more quickly available • Reweighting tools in this fast moving environment may not give us enough control to adapt to the component changes • Solution apply a “dynamic” microsimulation model
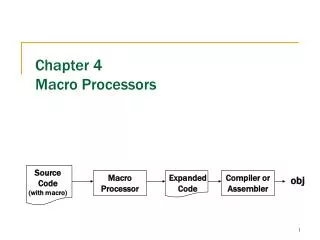
Methodology • Historical Simulation – micro data contains changes in all components simultaneously • Estimate a system of equations representing labour market states and income sources • Use Micro-simulation model to simulate each stage in turn on each micro population for historical years • See Bourguignon, F., Fournier, M, Gurgand, M. (2001) • Forward Simulation • Simulate income distribution from last data year using system of equations (dynamic microsimulation model) using official statistics based calibration totals • See O’Donoghue and Li (2012) • Simulate Disposable Income using Tax-Benefit Model In-work Capital Income Employee Self-Employed Retired Unemployed Inactive Part-time Farmer Non-Farmer SE Student Farm Y Public Contract SE Earnings Part-time Occupation Industry Earnings
Validation of Tax Benefit Model • Compare Simulated Tax-Benefit System with Actual Data • Assume 100% take-up as normal in microsimulation models • Trend broadly the same, although overall fall slightly less steep Equivalised Disposable Income (parametric equivalence scale, 0.5)
Changing one component at a time in all possible orders and taking average Gini – report the average difference in the Gini • Market Income Distribution Changes increasing inequality • Structure of labour market also reducing inequality • Demographic Structure U - shaped • Tax-Benefit Changes reduce inequality Annual Change in Inequality 2003-2008 due to Components Equivalised Disposable Income (parametric equivalence scale, 0.5)
However the direction of individual components can vary depending upon the order in which the analysis takes place • 24 pathways Results Path Dependent (2004)
Use Shapely measure to average all possible transitions • However some variability, particularly data and labour market participation Shapely and Variability of Change Labour Market Data-Demographic Market Income Tax-Benefit
Projection of Labour Market, Market Income and Policy • In order to project we use alignment or calibration • Firstly comparing history with alignment similar trend by higher inequality due to different employment rates between micro data and external data • Project using the same calibration totals Equivalised Disposable Income (parametric equivalence scale, 0.5)
Impact of Different Years • Starting simulation in different years • U-shaped trend is similar • But level depends upon starting point • Impact of Demographic change and Sampling Error Equivalised Disposable Income (parametric equivalence scale, 0.5)
Projecting • We observe continuing increase in Gini due to Market Income • However counter-balanced by increased redistributive effect of benefits • Partially composition, partially more progressive Redistributive Forces 2003-2011
Conclusions and Next Steps • Initial Crisis inequality reducing • However subsequently widening in 2011 • Labour Market and Market income Largely inequality increasing • Policy Inequality reducing • Assess overall Welfare impact • Incorporate impact on price • Less important distributionally than impact on overall purchasing power • Analyse Gender dimension • Differentiate Demographic Change from Sampling Variability • Intergenerational Change • Adjust for housing cost changes • Imputed rent has gone down, but housing costs have gone up