Download
1 / 10
100 likes | 247 Views
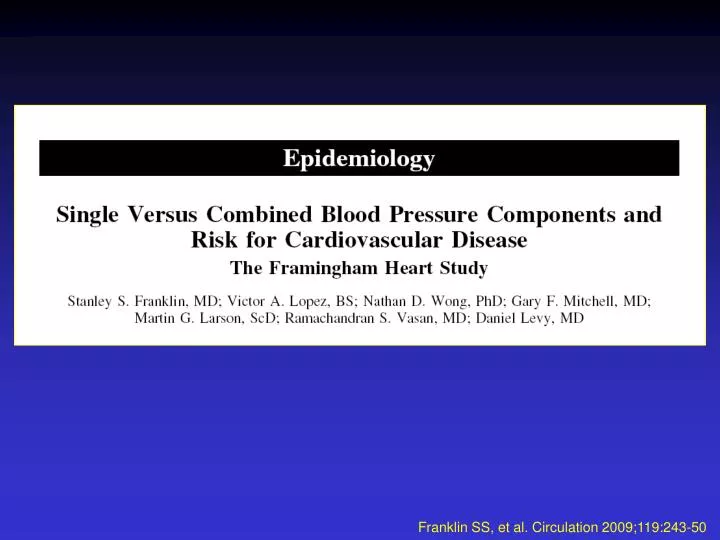
Franklin SS, et al. Circulation 2009;119:243-50. Descriptive and Baseline Characteristics of Framingham Original and Offspring Cohort. Franklin SS, et al. Circulation 2009;119:243-50. Frequency Distribution of CVD Events per Number of Person-Observations by SBP and DBP Groups.

E N D
Descriptive and Baseline Characteristics of Framingham Original and Offspring Cohort Franklin SS, et al. Circulation 2009;119:243-50
Frequency Distribution of CVD Events per Number of Person-Observations by SBP and DBP Groups Franklin SS, et al. Circulation 2009;119:243-50
ORs (95% CIs)* for CVD Events Based onCross-Classification of SBP and DBP Groups Franklin SS, et al. Circulation 2009;119:243-50
Likelihood Ratio Test and Receiver Operating Characteristic Analysis Comparing BP Models in Predicting CVD Franklin SS, et al. Circulation 2009;119:243-50
Odds for the likelihood of a cardiovascular event with combined SBP and DBP categories in a 6x6 cross-classification bar graph, adjusted for age, sex, total cholesterol, smoking, body mass index, diabetes, and secular trend. An interaction term of SBPxDBP improved the model fit (Δ2=35.9; P=0.02) Franklin SS, et al. Circulation 2009;119:243-50
Frequency Distribution of CVD Events per Number of Person-Observations by PP and MAP Groups Franklin SS, et al. Circulation 2009;119:243-50
ORs (95% CIs)* for CVD Events Based on Cross-Classification of PP and MAP Groups Franklin SS, et al. Circulation 2009;119:243-50
Odds for the likelihood of a cardiovascular event with combined PP and MAP categories in a 6x6 cross-classification bar graph, adjusted for age, sex, total cholesterol, smoking, body mass index, diabetes, and secular trend. An interaction term of PPxMAP improved the model fit (Δ2=43.1; P=0.01) Franklin SS, et al. Circulation 2009;119:243-50
CLINICAL PERSPECTIVE Franklin SS, et al. Circulation 2009;119:243-50


![CEREBRAL CIRCULATION AND CEREBROSPINAL FLUID [CSF]](https://cdn2.slideserve.com/4005143/slide1-dt.jpg)