Impact of Air-Sea Interactions on Hurricane Behavior: Insights and Findings
360 likes | 515 Views
This article explores the intricate relationship between air-sea interactions and hurricanes, focusing on how these interactions affect the track and intensity of tropical cyclones. It discusses key components of hurricanes and presents findings from numerical experiments investigating symmetric and asymmetric sea surface temperature anomalies. By analyzing different modeling scenarios, the paper aims to clarify the inconsistent results of previous studies regarding hurricane motion and intensity variations. A deeper understanding of these dynamics is crucial for improving hurricane forecasting and mitigation strategies.

Impact of Air-Sea Interactions on Hurricane Behavior: Insights and Findings
E N D
Presentation Transcript
How Air-Sea Interactions Affect Hurricanes! By: Tyler Sebree Major: Atm. Sci. Minor: Psychology Sooo Much Physics & Math, but Please Bare with Me!
The Article! • *Impacts of Air-Sea Interaction on Tropical Cyclone Track and Intensity* • By: Liguang Wu, Bin Wang & Scott A. Braun Hereeeee we go!
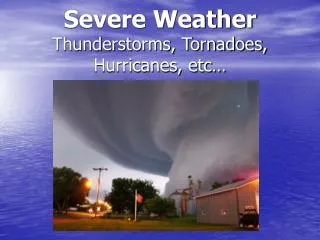
Yet Again, Background Info. • What Is A Hurricane??? Key Components: The Eye, Eye Wall, Central Dense Overcast, Outflow, Rainbands
LifespanofaHurricane TROPICAL STORM HURRICANE Tropical Depression (winds < 38mph)Tropical Storm (39-73mph)Hurricane(> 74mph)
The Saffir-Simpson Scale Otherwise known as the scale that measures a hurricane’s strength based on wind speed. However, a category 1 can be just as CATASTROPHIC as a category 5 because of the many other components of a hurricane (coming up on the next slide).
Elements of a Hurricane • 1. Winds 2. Heavy Rainfall 4. Tornadoes 3. Storm Surge/Rip Tides
Paper Time! • Purpose: determine relative roles of the weak symmetric and strong asymmetric sea surface temperature anomalies relative to the tropical cyclone center. • B/c other experiments didn’t…
Vocab/Background • *SST anomalies that result from 3-D coupled models of hurricanes make up the axially symmetric and asymmetric components relative to the TC center • Past studies say that the symmetric component of storm-induced SST anomaly field could play a key role in lowering storm intensity • Previous studies disagree regarding impacts of air-sea interaction on TC motion. One experiment (south) attributed differences in TC track to asymmetricprecipitation patterns that were shifted azimuthally (b/c I can’t think of any words to describe this word)… • Another experiment saw TC track to north. • Suggested “that this track deviation is related • to a systematic decrease in the azimuthally • averaged tangential flow of the TC vortex” • (Please do not ask about this statement -_- )
Paper’s Goals… • Determine if the symmetric SST anomalies are fully responsible for the lowering of storm intensity • To figure out why other studies have differing results regarding TC track
How It Went Down • Well, the a/symmetric SST • anomalies are investigated • numerically with a coupled • hurricane-ocean model. • Also, this study takes into • account other studies’ • contradictory results. Ex: • the impacts of air-sea • interaction on TC motion.
Coupled Hurricane-Ocean Model • …AND Experimental Design *First, we will look at the Hurricane Model component. Uses… 201 x 201 grid pointsw/ a uniform spacing of 25 km Primary model physics… 1. Large-scale condensation 2. Subgrid-scale cumulus convection parameterized w/ a Newtonian cooling 3. Surface fluxes of momentum, sensible and latent heat
Coupled Model (Cont.) • Ocean Model • *Oceanic response to forcing of moving TC can be divided into TWO stages… • Forced Stage Response: local response that includes OML currents of 1m/s and considerable cooling of OML in right rear quadrant near vertical mixing (lasts ½ day) • 2. Relaxation Stage Response: occurs after a TC passes; it is nonlocal & baroclinic in response to wind stress curl from TC (lasts 5-10 days)
More Ocean Model!! • ~I’ll try to explain this sentence: “The energy is spread through internal waves that penetrate into the thermocline (see picture), and leaves behind a baroclinic geostrophic current along the storm track.” • To account for the above craziness, this ocean model must be accompanied by OML physics (YAY!) and thermocline and upper ocean dynamics!
How about Some More Ocean Model? • This experiment takes into account 2 oceanic components: OML & thermo. • Finally, it’s math time! • Below thermocline layer is motionless deep layer (temp. Tr is constant) • In OML, temp. T1 and velocity are independent of depth • Thermocline layer = temp. decreases linearly from T1 to Tr • Equation relating variablesvertical temp. gradient in entrainment layer with thicknes is proportional to mean vertical temp. gradient in thermocline layer: Wish things were solved this way…
Experimental Design Table showing the three sets of idealized numerical experiments and each of their four respective experiments
Experimental Design (Cont.) • Table shows three sets of idealized numerical experiments with differing environmental influences • Different Sets: • E1simplest case; run on an “f” plane with a horizontally uniform easterly ambient flow • E2on beta plane in resting environ.; vortex movement arises from beta drift • E3combination of E1 and E2 • Different Experiments Conducted: • **Each set has 4 exp. conducted for it! • Fixed SST • Coupled • Symmetric-onlySST forcing • Asymmetric-only SST forcing
Where Do These Experiments Start? • Equation for the horizontal wind profile, v(r)… • Where r is the radius from the TC center & b is the shape parameter • All experiments begin with an identical, initially symmetric baroclinic vortex. • The max. tangential wind (Vm) of 25 m/s at rm = 100 km is at the lowest model level.
Ocean Response in Coupled Model -OML current increases quickly while the min. temp. decreases rapidly during first 24 hours
96 Hours (Cont.) • Graph (a): sea surface temp. anomaly • Graph (b): mixed layer depth anomaly • Graph (c): entrainment rate • Graph (d): thermocline depth anomaly • Graph (e): Currents in the mixed layer • Graph (f): Currents in the thermocline layer Both axes are distance in kilometers on all 6 graphs
Results (Air-Sea Interaction on TCs) • --The TC intensities and tracks are compared with the corresponding fixed-SST experiments discussed previously… • -------------------------------- • --Figure: depicts the overall air-sea interaction phenomenon this is the large system that’s being discussed in this paper. • -------------------------------- • --Its influence on TC intensity and track is crucial in terms of understanding TC’s strength and expected pathway
Results (I. Intensity Change) • Exp. E1 Left side = time series of the max. wind speed Right side = min. central pressure Exp. E2
Intensity Change (Cont.) Exp. 3 What these 6 graphs depict is the TC intensities for the three sets compared with the corresponding fixed-SST exp. In terms of the max. wind speed and min. central pressure
Intensity Change In Words • *MAIN POINT: air-sea interaction reduces TC intensity because of mixed layer cooling • Asymmetric Component… • Asymmetric SST field can affect TC intensity ONLY through the resulting inner-core TC asymmetries • Symmetric Component… • Overall, symmetric component plays key role in TC intensity
Results (II. TC Tracks)Part 1 TC tracks in fixed SST and coupled experiments (Left: E1 ; Right: E2)
TC TracksPart 2 E3 is on the left side and B2’s results are on the right side
TC TracksPart 3 B1 is on the left side & B3 is on the right side Q: What do 6 graphs have in common? A: Well, the TCs generally move westward in all scenarios
Track Change in Words • Influence of air-sea coupling on TC tracks is small but persistent • TCs in coupled exps. are displaced to the south compared to the corresponding exps. without air-sea interaction • Asymmetric convection w/ respect to a TC center can directly affect motion • Asymmetric-only forcing leads to increased rainfall rate compared w/ the fixed SST exp. TWO REASONS WHY • Intense hurricanes tend to be quite symmetric
Why is Rain Important? • Background Info if we consider the cyclonic rotation of air parcels as they rise, the enhanced rainfall rates are related to the positive SST anomalies ahead of the TC center • Thus, these persistent rainfall asymmetries typically shift the TC tracks marginally southward in coupled experiments of sets E2 and E3
Conclusions NOTES 1. Symmetric-only exp. results in northward moving storms 2. Asymmetric-only exp. results in southward moving storms 3. Fixed SST exps. are used to show how the symmetric & asymmetric SST exps. affect TC movement
OK, It’s The Last Conclusion Slide • The three sets of numerical experiments—each of which has four exps. conducted for it—are used in this experiment overall • The results are compared to previous data, which enables experimenters to produce major features of the ocean responses to moving TC forcing including OML deepening, SST cooling, & OML & thermocline layer currents • Influence of asymmetric component is small symmetric component cooling plays a key role in weakening TCs • Thus, evolution of TC can be simulated via only symmetric SST decreases caused by air-sea coupling • Asymmetric SST forcing intensifies the rainfall rates on the front left-hand side • Movement is variable depending on what component you are looking at
Tyler’s Opinion • Well, I think the experiment is very accurate, precise & has credible background information • The simplification of the information presented in the paper is not problematic in regards to the ending results • I think the two components—intensity and track—of TCs are both undoubtedly affected by air-sea interaction, even if it is only a slight amount • Also, I think there should be a continuance of experimentation in this subfield of atmospheric sciences/climatology b/c there are other variables (i.e., sea spray) that weren’t taken into account in this experiment • Lastly, I believe this b/c as time goes on and as the climate continues to evolve, TC components, configurations & characteristics could change, which could call for new experimentation being needed to study how air-sea interactions manipulate TC track and intensity