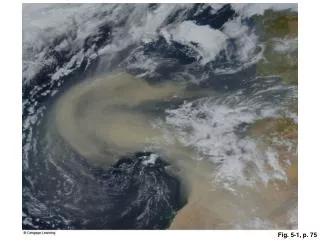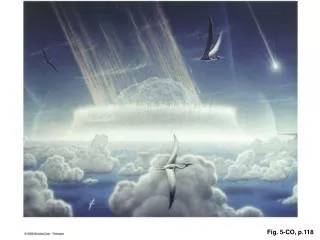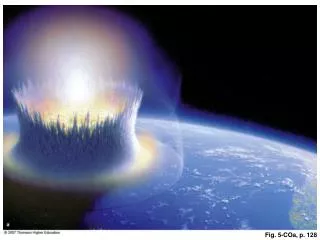
Fig. 5-COa, p. 128
520 likes | 698 Views
Fig. 5-COa, p. 128. Fig. 5-COb, p. 129. Age (Ma). cm. Events. 64.9. 50. Post-extinction layer: Sediments containing microfossils from after the dinosaurs. Tertiary. 65.0. Fireball layer: Dust and ash fallout from the asteroid impact. 60.

Fig. 5-COa, p. 128
E N D
Presentation Transcript
Age (Ma) cm Events 64.9 50 Post-extinction layer: Sediments containing microfossils from after the dinosaurs Tertiary 65.0 Fireball layer: Dust and ash fallout from the asteroid impact 60 Ejecta layer: Material blasted from the crater and deposited here within days to months 70 Cretaceous Fig. 5-COb, p. 129
Depth 2 1.25 1.9 3 4 2.5 Scour moat 3.1 5 4 6 km miles West East Fig. 5-4, p. 131
1,000 Erosion 100 20 cm /sec 10 Stream velocity (cm/sec) Transportation 1 cm /sec Deposition 1 .1 Clay Silt Sand Gravel .004 .06 2.0 100 A Particle size (diameter in mm) Fig. 5-5, p. 132
Erosion Transport Uplift Deposition Sedimentary beds Lithospheric plate Fig. 5-6, p. 133
Terrigenous deposits: Biogenous deposits: Hydrogenous deposits also present (manganese nodules) Calcareous oozes Continental margin sediments Siliceous radiolarian oozes Glacial-marine sediments Pelagic clays Siliceous diatom oozes Fig. 5-10, p. 137
Storm winds Sea level Wave base Substrate liquefied by wave activity Turbidity current Key Turbidity currents Submarine canyon Deep- sea fans Distance from shelf edge 100 50 150 km miles 0 50 100 Abyssal plain Continental rise Continental slope Sediment slump masses Graded beds of turbidites Continental shelf Underlying basaltic crust Fig. 5-12, p. 139
Storm winds Sea level Wave base Substrate liquefied by wave activity Turbidity current Key Turbidity currents Submarine canyon Deep- sea fans Distance from shelf edge 100 50 150 km miles 0 50 100 Abyssal plain Continental rise Continental slope Sediment slump masses Graded beds of turbidites Continental shelf Underlying basaltic crust Stepped Art Fig. 5-12, p. 139
CaCO3 accumulates above CCD Antarctic Arctic CaCO3 dissolves below CCD “Marine snow” CCD 4,500 meters Below CCD, water holds more CO2, which results in more carbonic acid, which dissolves CaCO3 faster. Fig. 5-15, p. 141
Hydrophone Burst of air Sound reflects from the junctions between sub-bottom layers Bottom Fig. 5-25, p. 148