Download

1 / 18
180 likes | 362 Views
No electronic rights for this image. Fig. 19.1, p. 476. Water Quality. Do (ppm) at 20˚C. Good. 8-9. Slightly polluted. 6.7-8. Moderately polluted. 4.5-6.7. Heavily polluted. Below 4.5. Gravely polluted. Below 4. Fig. 19.2, p. 478. Clean Zone. Decomposition Zone. Septic Zone.

E N D
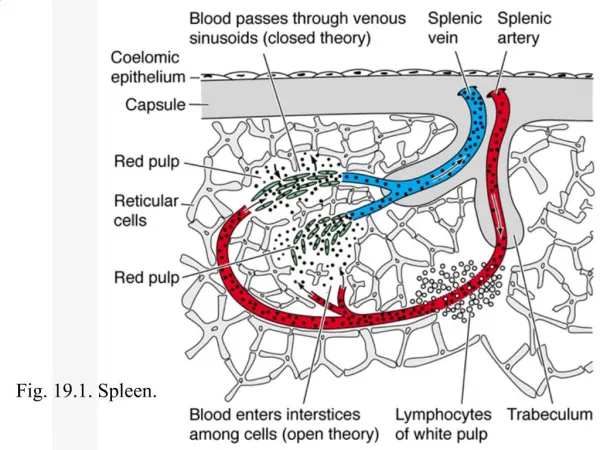
No electronic rights for this image. Fig. 19.1, p. 476
Water Quality Do (ppm) at 20˚C Good 8-9 Slightly polluted 6.7-8 Moderately polluted 4.5-6.7 Heavily polluted Below 4.5 Gravely polluted Below 4 Fig. 19.2, p. 478
Clean Zone Decomposition Zone Septic Zone Recovery Zone Clean Zone Normal clean water organisms (Trout, perch, bass, mayfly, stonefly) Trash fish (carp, gar, Leeches) Fish absent, fungi, Sludge worms, bacteria (anaerobic) Trash fish (carp, gar, Leeches) Normal clean water organisms (Trout, perch, bass, mayfly, stonefly) Types of organisms 8 ppm 8 ppm Dissolved oxygen Oxygen sag Concentration Biological oxygen demand 2 ppm Direction of flow Point of waste or heat discharge Time of distance downstream Fig. 19.3, p. 479
Water 0.000002 ppm Herring gull 124 ppm Phytoplankton 0.0025 ppm Herring gull eggs 124 ppm Lake trout 4.83 ppm Zooplankton 0.123ppm Rainbow smelt 1.04 ppm Fig. 19.4, p. 481
Discharge of untreated municipal sewage (nitrates and phosphates) Nitrogen compounds produced by cars and factories Natural runoff (nitrates and phosphates Discharge of detergents ( phosphates) Manure runoff From feedlots (nitrates and Phosphates, ammonia) Discharge of treated municipal sewage (primary and secondary treatment: nitrates and phosphates) Runoff from streets, lawns, and construction lots (nitrates and phosphates) Lake ecosystem nutrient overload and breakdown of chemical cycling Runoff and erosion (from from cultivation, mining, construction, and poor land use) Dissolving of nitrogen oxides (from internal combustion engines and furnaces) Fig. 19.5, p. 482
CANADA Nipigon Bay Jackfish Bay Thunder Bay Silver Bay St. Mary’s R. St. Lawrence R. Spanish R. St. Louis R. MICHIGAN Penetary Bay Sturgeon Bay WISCONSIN MICHIGAN Saginaw Bay NEW YORK Niagara Falls Saginaw R. System Grand R. MINNESOTA Niagara R. St. Clair R. Thames R. Buffalo R. Detroit R. Rouge R. Raisin R. Ashtabula R. PENNSYLVANIA IOWA Cuyahoga R. Maumee R. Rocky R. Black R. ILLINOIS INDIANA OHIO Great Lakes drainage basin Most polluted areas, according to the Great Lakes Water Quality Board “Hot spots” of toxic concentrations in water and sediments Eutrophic areas Fig. 19.7, p. 484
Industrial pollution Suffocated fish Beaches closed Sewage runoff Dead algae Low dissolved oxygen Decreased fish population Mercury- tainted fish Fig. 19.8a, p. 485
Suburban sprawl Lower water levels Clear water High dissolved oxygen PCB’s in sediment Thriving fish population Fig. 19.8b, p. 485
Waste lagoon, pond, or basin Hazardous waste injection well Mining site Water pumping well Buried gasoline and solvent tanks Pumping well Road salt Sewer Landfill Cesspoll, septic tank Leakage from faulty casing Unconfined freshwater aquifer Groundwater Confined freshwater aquifer Groundwater flow Discharge Confined aquifer Fig. 19.9, p. 487
Contaminated Probability 10 to 20 percent Greater than 20 percent Fig. 19.10, p. 488 Not tested
Industry Nitrogen oxides from autos and smokestacks; toxic chemicals, and heavy metals in effluents flow into bays and estuaries. Cities Toxic metals and oil from streets and parking lots pollute waters; sewage adds nitrogen and phosphorus. Urban sprawl Bacteria and viruses from sewers and septic tanks contaminate shellfish beds and close beaches; runoff of fertilization from lawns adds nitrogen and phosphorus. Constructionsites Sediments are washed into waterways, choking fish and plants, clouding waters, and blocking sunlight. Farms Run off of pesticides, manure, and fertilizers adds toxins and excess nitrogen and phosphorus. Red tides Excess nitrogen causes explosive growth of toxic microscopic algae, poisoning fish and marine mammals. Closed shellfish beds Closed beach Oxygen-depleted zone Toxic sediments Chemicals and toxic metals contaminate shellfish beds, kill spawning fish, and accumulate in the tissues of bottom feeders. Healthy zone Clear, oxygen-rich waters promote growth of plankton and sea grasses, and support fish. Oxygen-depleted zone Sedimentation and algae overgrowth reduce sunlight, kill beneficial sea grasses, use up oxygen, and degrade habitat. Fig. 19.11, p. 489
Mississippi River Basin Ohio River Missouri River Mississippi River LOUISIANA Mississippi River Depleted Oxygen Fig. 19.12, p. 490 Gulf of Mexico
Cooperstown NEW YORK PENNSYLVANIA ATLANTIC OCEAN Harrisburg NEW JERSEY MARYLAND Baltimore Washington WEST VIRGINIA DELAWARE Richmond Chesapeake Bay VIRGINIA Norfolk Drainage basin No oxygen Low concentrations of oxygen Fig. 19.13, p. 490
Septic tank Nonperforated pipe Manhole (for cleanout) Household wastewater Drain field Perforated pipe Gravel or crushed stone Distribution box (optional) Vent pipe Fig. 19.14, p. 494
Secondary Primary Grit chamber Chlorine disinfection tank Bar screen Settling tank Aeration tank Settling tank To river, lake, or ocean Raw sewage from sewers (kills bacteria) Sludge Activated sludge Air pump Sludge digester Sludge drying bed Disposed of in landfill or ocean or applied to cropland, pasture, or rangeland Fig. 19.15, p. 494
Specialized compound removal (DDT, etc.) Effluent from Secondary treatment Alum flocculation plus sediments Desalination (electrodialysis or reverse osmosis) Activated carbon Nitrate removal 98% of suspended solids 90% of phosphates To rivers, lakes, streams, oceans, reservoirs, or industries 98% of dissolved organics Most of dissolved salts Recycled to land for irrigation and fertilization Fig. 19.16, p. 495
(1)Raw sewage drains by gravity into the first pool and flows through a long perforated PVC pipe into a bed of limestone gravel. (3) Wastewater flows through another perforated pipe into a second pool, where the same process is repeated. Sewage Treated water Wetland type plants Wetland type plants 45 centimeter layer of limestone gravel coated with decomposing bacteria First concrete pool Second concrete pool (2) Microbes in the limestone gravel break down the sewage into chemicals, that can be absorbed by the plant roots, and the gravel absorbs phosphorus. (4) Treated water flowing from the second pool is nearly free of bacteria and plant nutrients. Treated water can be recycled for irrigation and flushing toilets. Fig. 19.17, p. 497