Download

1 / 9

E N D
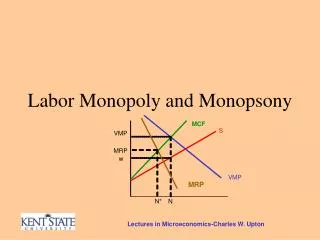
On the next slide I have reproduced something from a previous section. Note the marginal labor cost is greater than the wage at each labor amount because in order to get more labor the firm would have to pay all workers the higher amount. Thus the MLC at a labor amount reflects both the increased cost from the additional worker and the additional amount that each of the previous workers would get. For example, with two workers the marginal labor cost is 7. This is made up of the 6 for the 2nd worker and the first worker would get 6 instead of 5 that the first worker would have gotten if only one worker was taken.
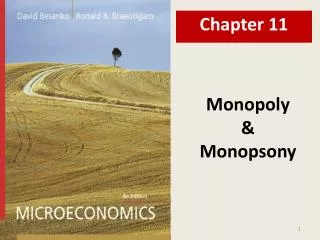
Wage Qs TLC MLC 4 0 0 xxx 5 1 5 5 6 2 12 7 7 3 21 9 8 4 32 11 $ MLC S 8 7 6 5 1 2 3 4 E A nondiscriminating monopsonist has to pay all the workers hired the same amount. TLC is the total labor cost (just the wage times the Qs) and MLC is the marginal cost of labor (the change in TLC divided by the change in labor supplied Qs).
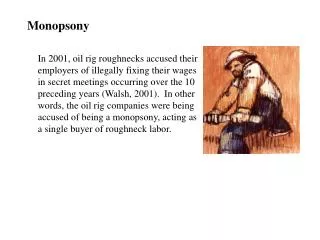
Now, say a minimum wage is enacted at $7 per hour. I have reproduced the table from before and put in parentheses the new values for TLC and MLC. I kept the wage column the same, although you could probably argue to make any wage below the minimum that wage. Wage Qs TLC MLC 4 0 0 xxx 5 1 5 (7) 5 (7) 6 2 12 (14) 7 (7) 7 3 21 (21) 9 (7) 8 4 32 (32) 11 (11) What the minimum wage does is change the MLC to a constant at 7 for all those units of labor that would have been supply at wages of 7 or less.
In the graph at the right you see the old MLC curve as the thin line. The new MLC curve is horizontal at the minimum wage. When labor supply is 3 the MLC curve is vertical and after that the MLC curve follows the old MLC. $ MLC S 8 7 6 5 1 2 3 4 E So, in general, with a minimum wage the MLC is horizontal at the minimum wage until you get to the supply line, from there it becomes vertical, and after that it follows the original MLC line.
$ MLC S Wc W1 MRP = D L L1 Lc Case 1 L’
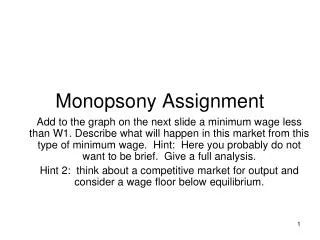
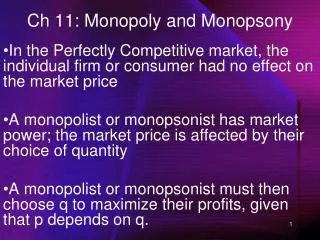
Case 1 Say the minimum wage enacted in a monopsony market is below what would be in the market with competition, but above the monopsony wage. Here the firm would want the labor amount L’ because that is where MRP = MLC and if it pays the minimum wage that many workers will work. Thus the equilibrium wage is the minimum wage and the equilibrium amount traded would be L’. So, this type of minimum wage can actually make employment go up – no unemployment from a minimum wage!
$ MLC S Wc unemployment W1 MRP = D L L1 Lc Case 2 L’ L’’
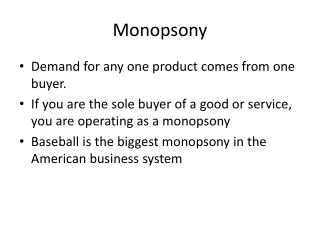
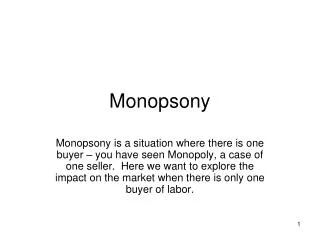
Case 2 Say the minimum wage enacted in a monopsony market is above what would be in the market with competition. . Here the firm would want the labor amount L’ because that is where MRP = MLC and if it pays the minimum wage. Thus the equilibrium wage is the minimum wage and the equilibrium amount traded would be L’. But, at this wage, L’’ workers want to work. L’’ – L’ is unemployment. Unemployment can result from the monopsony model.