Monopsony
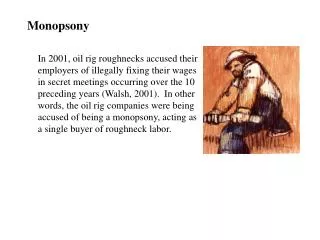
Monopsony. In 2001, oil rig roughnecks accused their employers of illegally fixing their wages in secret meetings occurring over the 10 preceding years (Walsh, 2001). In other words, the oil rig companies were being accused of being a monopsony, acting as a single buyer of roughneck labor. .

Monopsony
E N D
Presentation Transcript
Monopsony In 2001, oil rig roughnecks accused their employers of illegally fixing their wages in secret meetings occurring over the 10 preceding years (Walsh, 2001). In other words, the oil rig companies were being accused of being a monopsony, acting as a single buyer of roughneck labor.
Suppose the supply of roughnecks (RN) is: Where w is their hourly wage and L is measured in thousands of roughnecks per hour. Wage ($ per hour) If we ↑ from 30 to 50 thousand, Supply Labor (thousands per hour)
Suppose the supply of roughnecks is: Where w is their hourly wage and L is measured in thousands of roughnecks per hour. Wage ($ per hour) If we ↑ from 30 to 50 thousand, then TE on will ↑ by $450 thousand. The MC of will, on average be Supply Labor (thousands per hour)
Suppose the supply of roughnecks is: Where w is their hourly wage and L is measured in thousands of roughnecks per hour. Wage ($ per hour) If we ↑ from 30 to 50 thousand, then TE on will ↑ by $450 thousand. The MC of will, on average be Supply Labor (thousands per hour)
Suppose the supply of roughnecks is: Where w is their hourly wage and L is measured in thousands of roughnecks per hour. Wage ($ per hour) MC If we ↑ from 30 to 50 thousand, then TE on will ↑ by $450 thousand. The MC of will, on average be Supply Labor (thousands per hour)
Alternative Derivation of the MC curve Supply Curve: Hence,
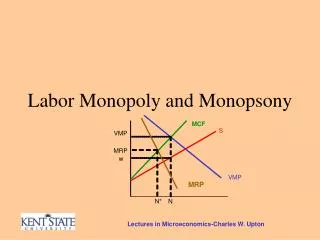
Suppose the demand for roughnecks (MRP) is: Wage ($ per hour) MC Monopsonies pay lower wages and hire fewer workers than competitive markets Supply Demand=MRP Labor (thousands per hour)
Oil rig roughnecks suspected that their employers were colluding by setting wages because wages “barely budged during labor shortages in 1997 and in 2000 after oil prices rose and drilling companies rushed to put idled rigs into production” (Walsh, 2001). Lin, Chung-Cheng. 2002. “The Shortage of Registered Nurses in Monopsony: A New View from Efficiency Wage and Job-Hour Models, The American Economist , 46(1) Spring: 29-35
Principal Research Question: What effect does increasing the minimum wage have on the price of restaurant meals? Why is it important? It tests whether the labor market for restaurant workers is competitive or monopsonistic. “Our findings suggest that employment remains unchanged, or sometimes rises slightly, as a result of increases in the minimum wage. This conclusion poses a stark challenge to the standard textbook model of the minimum wage.''
Illustrate the effect of the imposition of a minimum wage of labor and output markets, first assuming that both markets are competitive. Competitive Labor Market Market for Restaurant Meals Wage Price Permanent Surplus S2 Supply S1 Demand =MRP D Labor Quantity
Illustrate the effect of the imposition of a minimum wage of labor and output markets, first assuming that both markets are competitive. Wage MC Supply Demand=MRP Labor
Illustrate the effect of the imposition of a minimum wage of labor and output markets, first assuming that both markets are competitive. Wage MC Supply Demand=MRP Labor
Illustrate the effect of the imposition of a minimum wage of labor and output markets, first assuming that both markets are competitive. Wage MC Supply Demand=MRP Labor
Illustrate the effect of the imposition of a minimum wage of labor and output markets, first assuming that both markets are competitive. MonopsonisticLabor Market Market for Restaurant Meals Price Wage MC S1 S2 Supply Demand=MRP D Quantity Labor
Aaronson, French and MacDonald (2008) estimate the relationship between minimum wages and restaurant prices to infer whether labor markets are competitive or monopsonistic.
AFM’s Empirical Model BLS restaurant-level data for 3 years, 1995-1997 Fed increased from $4.25 to $5.15 over these years AFM’s Data
AFM’s Principal Result “We find that a 10 percent increase in the minimum wage increases prices by roughly 0.7 percent” (Aaronson, French and MacDonald, 2008, 697). If