Download

1 / 25
250 likes | 403 Views
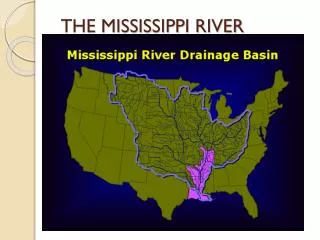
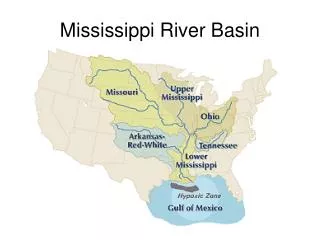
SPARROW Modeling in the Mississippi River Basin. By Dale M. Robertson* and David A. Saad, USGS, Wisconsin Water Science Center. Iowa Science Assessment Davenport, IA Nov. 14, 2012 *dzrobert@usgs.gov (608) 821-3867. Gulf Hypoxia.

E N D
SPARROW Modeling in the Mississippi River Basin By Dale M. Robertson* and David A. Saad, USGS, Wisconsin Water Science Center Iowa Science Assessment Davenport, IA Nov. 14, 2012 *dzrobert@usgs.gov (608) 821-3867
Gulf Hypoxia Early results suggested this was driven by Nitrogen Loading from the basin, now maybe both Nitrogen and Phosphorus
Typical Goals of SPARROW Modeling: 1. Determine P and N loading to various receiving waters over large spatial scales. 2. Determine where are the main contributing basins (Rank contributing basins based on loads and yields). 3. Determine what are the main causes of the high loads(Describe the relative importance of nutrient sources). 4. Provide information to various states and regional organizations to support regional interpretation and guide local, more indepth studies.
Sources Upstream Flux as qI qD qI Instream Transport and Decay Land-to-water transport SPARROW Mass Balance modeling approach: - Regress water-quality conditions (monitored load) on upstream sources and factors controlling transport Monitored load Long-term Detrended
Robertson et al. (2009) SPARROW N Model Yield, kg/km2
Sources Contributions to Stream Nutrient Flux Conclusions from the National SPARROW model applied to the Miss. River Basin Alexander et al., 2008
9,000 8,000 7,000 6,000 Incremental N Yield (x 106 kg/km2) 5,000 4,000 3,000 2,000 1,000 0 0 50 100 150 200 250 300 350 400 450 500 550 600 650 700 750 800 Original Rank 90% Confidence Intervals for Yields and Ranks Horizontal Bars demonstrate the 90% confidence limits on the individual ranks Robertson, et al. 2009
Upper Midwest SPARROW Model Calibration One Source: 2002 Farm Fertilizer TP inputs, kg One Land-to-Water Delivery: Soil Permeability Calibration River Network – RF1 Long-term detrended Loads for 810 sites
Total Phosphorus Yields (kg/km2) Total Phosphorus Yields (kg km-2) 0 – 12 0 – 12 13 - 17 13 - 17 18 - 25 18 - 25 25 - 33 25 - 33 34 - 41 34 - 41 42 - 51 42 - 51 52 - 64 52 - 64 65 - 83 65 - 83 84 - 114 84 - 114 115 - 1000 115 - 1000 1001 – 2,980 1001 – 2,980 Distribution in Incremental Phosphorus Yields Distribution in Incremental Phosphorus Yields Superior Superior Huron Huron Ontario Ontario Michigan Michigan Erie Erie
How do the yields to the Great Lakes Basins compare with each other and with those from other nearby large river basins? Phosphorus Yields
3 9 5 - 2 1 5 4 3 0 # 2 1 5 4 3 0 - 7 9 2 8 2 7 # 7 9 2 8 2 7 - 2 4 6 3 3 6 2 # 2 4 6 3 3 6 2 - 6 9 2 3 1 2 9 # 6 9 2 3 1 2 9 - 2 3 5 9 6 1 3 2 2 6 # # 5 6 - 1 6 4 8 5 1 6 4 8 5 - 5 4 4 3 6 # 5 4 4 3 6 - 1 4 7 7 1 0 # # 1 4 7 7 1 0 - 5 0 1 3 0 7 5 0 1 3 0 7 - 2 5 4 8 0 8 1 1 6 # 2002 TN Sites (937 sites > 856 sites) Modeling Sites 2002 load estimates for SPARROW model (then removed sites with poorly predicted loads or large potential biases) TN Load kg/yr 2002 TP Sites (1,192 sites > 988 sites) TP Load kg/yr
MARB 2002 Refined Nitrogen SPARROW Model Preliminary Results
Fertilizers Manure Manure Fixation plus other Ag Geologic Phosphorus Sources Nitrogen Sources Fertilizers
Future SPARROW Modeling – NHD Plus Scale (1:100,000) Using HydroSPARROW to predict the effects of changes in Climate (hydrology) and Land Use
Methods to demonstrate results and help guide decisions (Being Demonstrated Tonight!) 1. SPARROW Mapper – Easy and simple way to get SPARROW results 2. Decision Support System
Methods to demonstrate results and help guide decisions 1. SPARROW Mapper 2. Decision Support System Scientists/Managers – Capable of using to visualize SPARROW output and run various scenarios. Booth et al., 2011
SPARROW Modeling in the Mississippi River Basin By Dale M. Robertson* and David A. Saad, USGS, Wisconsin Water Science Center Iowa Science Assessment Davenport, IA Nov. 14, 2012 *dzrobert@usgs.gov (608) 821-3867