Download
1 / 34
350 likes | 381 Views
Explore the integration of spatial data for urban assessment, including urban metabolism concepts, land and ecosystem accounting, European data sources, and downscaling environmental information for better analysis. Enhance data capabilities and support future research needs.

E N D
Spatial data for integrated assessment of urban areas Andrus Meiner European Forum for Geostatistics 12 October 2011, Lisbon
Outline • EEA work experience with geospatial grids • Examples of urban data used in State of Environment 2010 report • Urban metabolism as a central concept of IUME - Integrated Urban Monitoring for Europe
Improving our knowledge baseICT strategy towards 2013 • Enhance the EEA‘s capabilities around spatial data • Spatial data sharing and integration, support to INSPIRE • Increase EEA capacity to handle new types of data • near real time data, satellite data, citizen observations (through mobile devices), models • Strengthen role of EEA as European Environmental Data Centre and • contribute to the European Spatial Data Infrastructure
Use of reference grids in the EEA • Grids for reporting and analysis • no primary data collection on grids • Grid-systems with Europe-wide coverage • EEA has extra-EU coverage of 32 + 7 countries • Grids hierarchy for different needs e.g. 0.1, 1, 10 km • Grids are used to analyse the environmental issues and variables • need for gridded socio-economic data • Increased use of grids in future • data integration and assimilation
Concept: Land and Ecosystem Accounting (LEAC)CORINE Land Cover:1990-2000-2006Next CLC 2012
The approach to generate the land accounting record for a stock
Indicators for Europe based on CLC2006 and change data Portugal Source: EEA, based on Corine LC 2006
Urban Growth in Europe Urban growth Economic sites Residential sites Population
IUMEIntegrated Urban Monitoring in Europe Combining European data sources and approaches: different urban delineations and indicators of urban flows data questions system http://iume.ew.eea.europa.eu/
Data: overviewmain typologies of urban delineations in Europe • Urban Audit • Urban Atlas • GMES Land (Corine LC Class 1, HR Soil sealing) • UMZ Urban Morphological Zones (built up areas less than 200 m apart) • ESPON • MUA Morphological Urban Areas • FUA Functional Urban Areas (beyond admin borders) • MOLAND (urban areas + periurban buffers) • Air quality Zones and agglomerations in relation to EU air quality thresholds • Noise urbanised areas (defined by MS)
Data: types, scales, time series Eurostat Urban Audit CORINE Land Cover Soil sealing Noise Urban Atlas AirBase Water (WTP) Noise (END) European Soil DB Natura 2000
Urbancoverage 10% Europe 60% Population
Intensity soil sealing
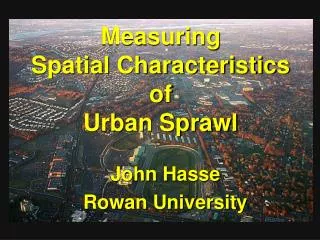
Nature need for urban green areas
Climate change adaptation: heat wavesDegree of soil sealing (UMZ) and predicted increase of tropical nights
Static Dynamic Different delineations for different purposes Planning & Management Administrative Socio-economic Functional Biophysical process Morphological
Weighted by Population Population Grid 2001 (JRC) Unemployment 2001 (Eurostat) Ref. Grid 1ha Disaggregation Integration OLAP CUBE Integration Aggregation CLC 2000 (EEA) Regular grid - common interface for integration different delineations and other types of data different spatial reporting units
System: Basic metabolism conceptPhysical exchanges between the urban system and the environment Metabolic inflows and outflows Recycling Input Economy Output Source for Urban Metabolism concept: Minx et al., 2011
Determinants of urban metabolism
Basic structure of the proposed indicator system (4 types) Extending the urban metabolism concept for environmental impacts Adapted from Alberti (1996)
Quantifying urban metabolismDownscaling data to levels of higher spatial resolution • Pragmatic, feasible indicator system • administrative delineations of cities as boundaries, • metabolic flows as main content • Additional information on urban drivers, patterns and quality • Potential of a geo-demographic approach • higher spatial resolution • more variables (flows, patterns, lufestyles) • downscaling environmental information • Urban metabolism as systemic backbone for IUME - Integrated Urban Monitoring for Europe
- Synthesis • - Part A – Europe and the World • ... • Urbanisation and consumption • ... • - Part B – Thematic assessments • ... • Land use • Urban environment • ... • - Part C – Country sketches http://www.eea.europa.eu/soer
Thank you!http://www.eea.europa.euContact: Andrus.Meiner@eea.europa.eu
The aim of IUME initiative • Provide an overview about existing urban delineation in Europe and their context, • Show the consequences of working with different delineations, and • Develop methods and tools to overcome the difficulties and show ways for data integration
Future research needsDownscaling data to levels of higher spatial resolution • allowing better links between urbanisation dynamics, sprawl and their environmental impacts in more detail. • Availability of metabolic flow data for functional and morphological urban delineations, not only for administrative geographies. • Potential of geo-demographics. • A scoping of requirements for data with a higher spatial resolution across European institutions. • Review of methods for downscaling information.