Download
1 / 18
180 likes | 307 Views
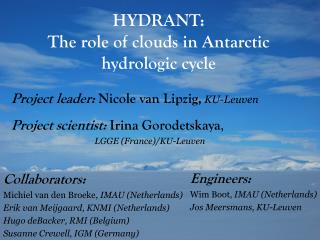
HYDRANT: The role of clouds in Antarctic hydrologic cycle. Project leader: Nicole van Lipzig, KU-Leuven. Project scientist: Irina Gorodetskaya , LGGE (France)/KU-Leuven. Engineers: Wim Boot, IMAU (Netherlands) Jos Meersmans, KU-Leuven. Collaborators:

E N D
HYDRANT:The role of clouds in Antarctic hydrologic cycle Project leader: Nicole van Lipzig, KU-Leuven Project scientist: Irina Gorodetskaya, LGGE (France)/KU-Leuven Engineers: Wim Boot, IMAU (Netherlands) Jos Meersmans, KU-Leuven Collaborators: Michiel van den Broeke, IMAU (Netherlands) Erik van Meijgaard, KNMI (Netherlands) Hugo deBacker, RMI (Belgium) Susanne Crewell, IGM (Germany)
HYDRANT : The role of clouds in Antarctic hydrologic cycle General description of the project To understand the current and future evolution of the Antarctic and Greenland ice sheet, and their contribution to sea-level changes, an in-depth knowledge of the surface mass balance (SMB) of these ice sheets (sum of precipitation, sublimation, run-off and snowdrift) is essential. We use regional atmospheric models as tools for studying the SMB, but they are useful only if they are realistically representing the meteorological conditions in the region of interest. Therefore, we need high-quality measurements to evaluate these models. With this project, we want to establish a database that can be used for an in-depth model evaluation of the Antarctic hydrologic cycle. Most evaluation studies are restricted to an evaluation of the net accumulation. However, clouds are of importance for an adequate representation of the hydrological cycle. Precipitation and cloud liquid water/iceare coupled and models are found incapable of sustaining high amounts of liquid water without producing precipitation. When atmospheric models are used to study the sensitivity of snowfall to climatic changes, it is important that not only surface precipitation is correctly represented, but also the other processes occurring in the chain from evaporation at the surface to snowfall, which we refer to as the atmospheric branch of the hydrological cycle. If the representation of clouds in atmospheric models is incorrect, we cannot have confidence in the sensitivity of the SMB to climatic changes.
Dronning Maud Land+ Princee Novo Princess Elisabeth
Belgian Antarctic research station Princess Elisabeth 71o57’ S, 23o20’ E
The base is located on the Utsteinen ridge... ... 300 m north from the Utsteinen nunatak... Utsteinen nunatak is part of Sor Rondane Mountains more mountains to the south east from Utsteinen... Around the Princess Elisabeth base... The north is open with only two mountains 30 and 60 km away... after which the way to the coast lays through the bare ice field
Global climate Antarctic weather Clouds Precipitation Temperature Modèle Atmosphérique Régional (LGGE): July sfc temperature Princess Elisabeth base is located 200 km from the coast and is influenced both by the cold katabatic flow from the Antarctic interior and by cyclones bringing moisture and heat from the lower latitudes Surface mass balance Global sea level
HYDRANT measurements Instruments installed in February 2009: Automatic Weather Station (meteo, radiative fluxes, snow temperature profile) Ceilometer uses a laser to determine vertical backscatter profile and cloud base height Infra-red radiation pyrometer measures temperature from the amount of thermal radiation emitted by the atmosphere, in particular the cloud base temperature when the clouds are present (equivalent blackbody brightness temperature) Instruments to be installed: Micro Rain Radar detects radar backscatter fromfalling and drifting snow as a function of height. Therefore it is possible to distinguish between events where only blowing snow was present from events where there was precipitation falling. Microwave Radiometer measures energy emitted at microwaves, from which we can derive the total amount of water vapor and the total amount of liquid water in the atmospheric column directly above the instrument.
Princess Elisabeth, Utsteinen, Antarctica Polar Automatic Weather station (IMAU, AWS 16) in collaboration with M.R. van den Broeke and Wim Boot 200 m east from Utsteinen ridge 71o57', 23o21’, Height = 1420m North to South East to West South to North West to East
Meteo during February 2009 Day temperatures : min = -20 C (20h Feb 16) max = -4 C (12h Feb 9) Relative Humidity : 25 - 97 % wind speed : 0.5 - 13 m/s (during storm up to 30 m/s) wind dir : S-SEE (0.5-10 m/s) SW-NW (0.5-4 m/s) pressure : 805 - 838 hPa
Storm development Feb 11 pyrometer strong warming during the storm... Cloud Temperature, C mid cloud low cloud snow drift/fall Cloud height, ft ceilometer
storm picture Storm on February 11...
Storm development Feb 20 : ceilometer data mid level clouds formed during the night Time (hours) light snow fall started later in the afternoon high and mid level clouds appeared in the afternoon snow fall continued for another hour... strong wind and blowing snow created white-out conditions near the surface... Time (hours)
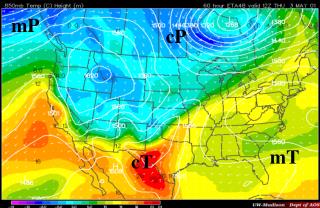
meteo during Feb 20 storm:Princess Elisabeth (x) was in the periphery of a deep cyclone x x maps provided by Neumayer station x x
Storm on February 20... strong wind and drifting snow... Visibility about 2 meters... up to 60-knot wind carries snow over the ridge...
HYDRANT: • Lack of understanding Antarctic precipitation controls =>Antarctic mass balance => global sea level • Need for validating climate models • System measurements: meteorology + clouds + precipitation • Use data to improve and apply polar mesoscale model